
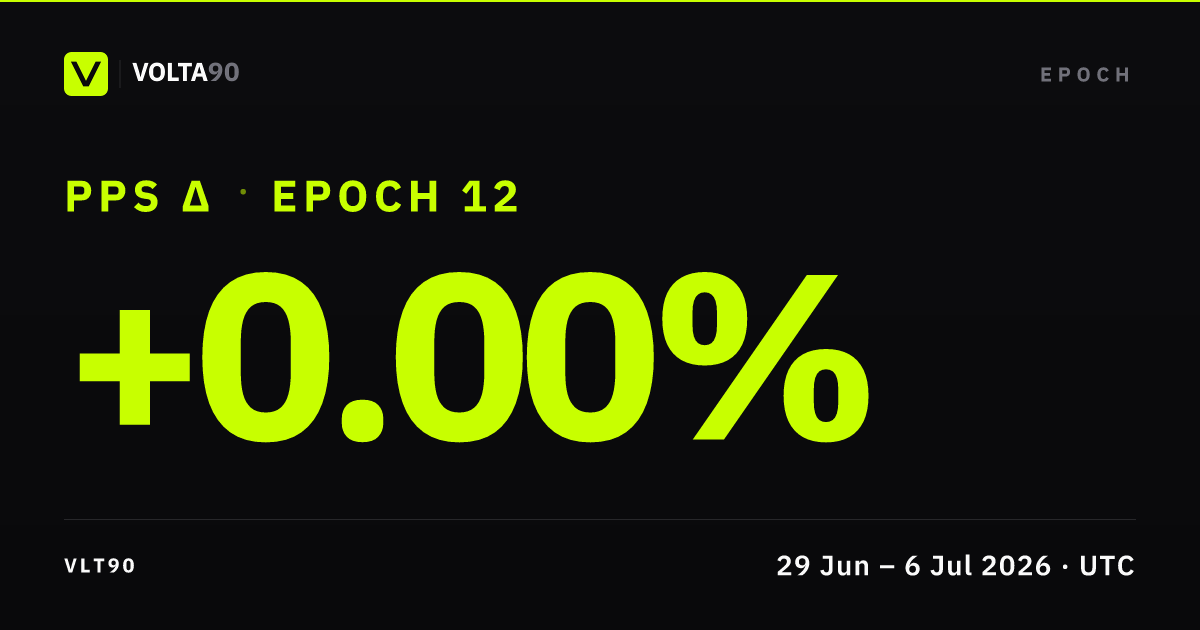
Epoch card
Operator desk note
As the United States approached the Independence Day holiday on July 4th, Volta90's investment strategy provided a clearer picture of the market's status at the start of the second half of 2026. Since early June, we have observed a typical correction and consolidation phase following the strong upward movement in April and May. This rally was largely driven by leaders in the semiconductor sector, AI-dedicated memory, and neo cloud technologies. However, some ETFs tracking semiconductor performance and indices like South Korea's Kospi experienced significant corrections in June.
Despite these declines in the high-profile AI sectors, market rotation into less favored sectors such as healthcare, financials, and defensive sectors like consumer staples compensated for the losses. As a result, the S&P 500 and Nasdaq indices are showing a consolidation pattern within a broad range, remaining not too far from the record highs of early June 2026. Currently, there is no graphical indication of an impending crash.
In response, Volta90's portfolio strategy will continue to deploy cash during market weaknesses, focusing on tech and semiconductor leaders while maintaining a diversified portfolio that includes metals, healthcare, and brokerage sectors. We anticipate this intermediate correction phase will lead to another upward wave, likely extending over several weeks before the end of 2026. We do not believe the AI-driven bull market is ending or that a crash is imminent. Instead, we have witnessed a purge of over-leveraged investors, particularly in Asian markets and leveraged ETFs. Once this purge concludes, the underlying bullish trend is expected to resume.
During the week of June 29 to July 5, there were significant rotation movements in the financial markets. Major profit-taking and value destruction occurred in AI star stocks, particularly in semiconductors, memory, NeoCloud, and computing power sectors. Given the heavy weighting of semiconductors and AI memory in U.S. indices, this has impacted the NASDAQ, resulting in a slightly bearish trend since early June. The semiconductor ETF (SMH) has dropped nearly 20% from its peak in June.
We are witnessing a highly volatile market environment, making positioning more challenging. However, Volta90's analysis tools do not suggest an imminent major crash. Instead, we see sector rotation, albeit sudden and sharp, with capital flowing into previously overlooked sectors like finance, industrials, and notably healthcare and biotech. In this volatile environment, Volta90 has intentionally maintained a significant cash position in its allocation. This cash will be gradually deployed in two stages: first, into diversified sectors such as finance, healthcare, and potentially biotechs, with stocks like HIMS&HERS likely to be added to the portfolio soon. Second, once additional stabilization signals in the semiconductor sector are confirmed, cash will be redeployed into ETFs and leading stocks in semiconductors, AI, and computing power sectors. This strategy aims to capture a substantial increase in NAV during the next market-wide upward wave.
Performance
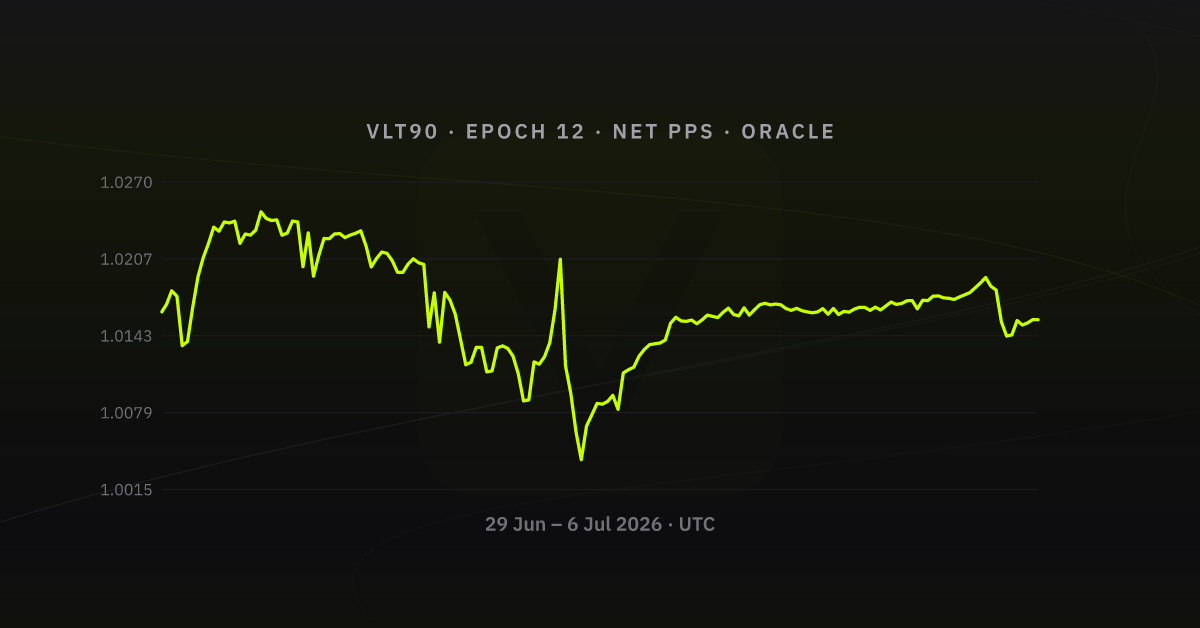
Over 2026-06-29 → 2026-07-06, net share price printed low 1.004001 and high 1.024570. The largest drawdown from a running intra-week high landed at 2.01%. That is the clearest stress point on the path. The low-to-high band was ~2.02% off week open, a normal swing week, not a flat line. Little net change week open → close (≈ -0.06%), mostly two-way chop inside that band. Open Performance in the app for the same net PPS basis with full zoom.
What drove the week
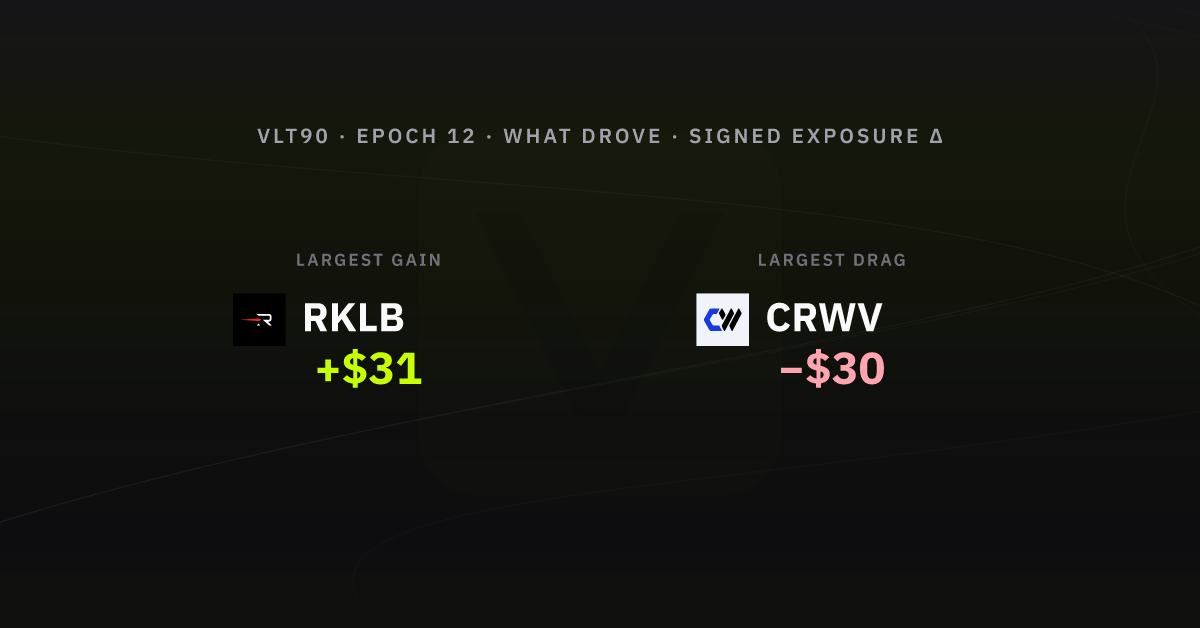
From week-open to week-end oracle snaps (cash sleeves excluded; perps: Δ unrealised P&L; spot: notional), sleeve-level marks moved most in favour of  RKLB +$31 and most against
  CRWV −$30. Other listed names on the same basis moved:
  MU −$27,
  CRCL −$26,
  DRAM −$19,
  MRVL −$11,
  Nasdaq 100 +$3, and
  LLY +$1.
Allocation by asset class & gross exposure
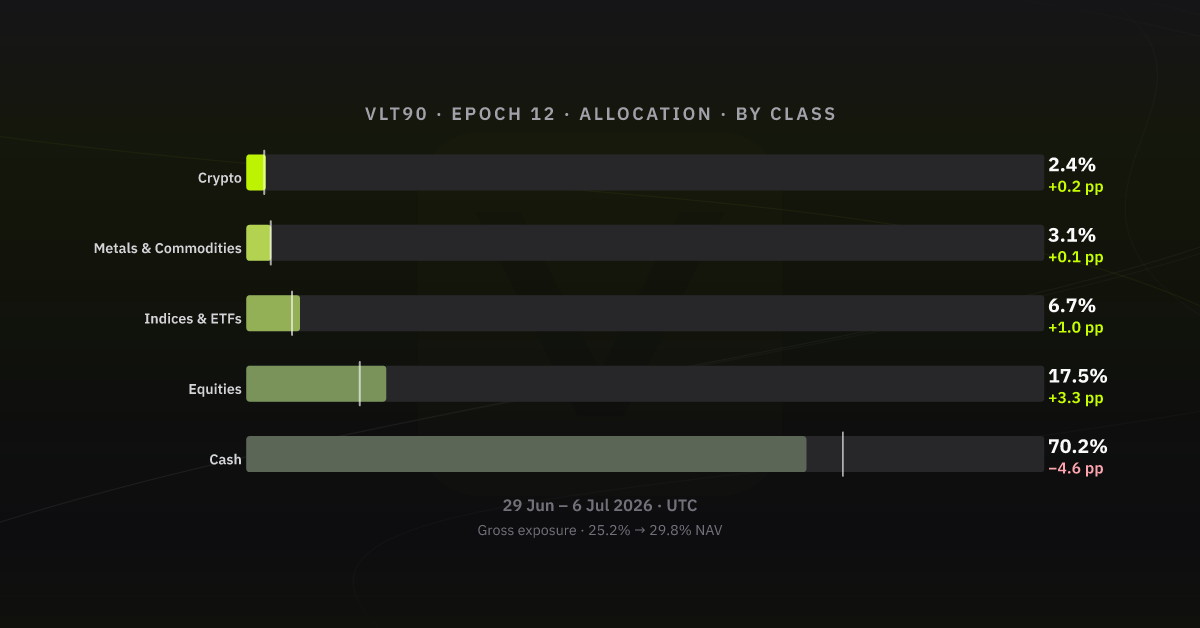
The clearest sleeve moves vs week open are Cash −4.6 pp, Equities +3.3 pp, and Indices & ETFs +1.0 pp. Gross exposure (deployed notional / NAV) moved from 25.2% to 29.8% of NAV. (-4.7 pp on gross exposure vs prior week-end). Same asset-class bands as Allocations (History tab); figures are % of vault NAV.
Listed clips: Hyperliquid
| Time (UTC) | Instrument | Side | Size | Price | Fee | Realised close P&L |
|---|---|---|---|---|---|---|
| 2026-06-29 11:37:54 | RKLB |
Open Long | 1.3900 | 93.0440 | USDC 0.0112 | - |
| 2026-06-29 14:38:15 | DRAM |
Open Long | 1.0000 | 68.0860 | USDC 0.0059 | - |
| 2026-06-29 15:13:29 | LLY |
Open Long | 0.1242 | 1207.3000 | USDC 0.0135 | - |
| 2026-06-30 00:00:00 | HL spot / stable basket | Spot Dust Conversion | 0.0060 | 1.0000 | USDC 0.0000 | - |
| 2026-06-30 14:20:27 | CRCL |
Open Long | 1.1410 | 70.1180 | USDC 0.0069 | - |
| 2026-06-30 14:22:18 | MU |
Close Long | 0.0370 | 1149.7000 | USDC 0.0037 | 9.1619 |
| 2026-06-30 14:23:48 | CRWV |
Open Long | 0.6200 | 99.3110 | USDC 0.0053 | - |
| 2026-07-02 12:58:57 | MRVL |
Open Long | 0.5400 | 274.1100 | USDC 0.0128 | - |
| 2026-07-02 20:02:12 | Nasdaq 100 |
Open Long | 0.0033 | 29317.0000 | USDC 0.0084 | - |
Realised P&L on closes (what Hyperliquid books when a position is closed):
- MU +$9, about +21.54% vs the dollar size of that trade (size × price)
Total from these closes: about +$9, or about +0.06% of the vault’s opening NAV for the week. Trading fees on those fills are not subtracted here.
Appendix - sources & verification
GET https://api.volta90.trade/transactions/VLT90/epoch/12/timeline?full=true
GET https://api.volta90.trade/oracle/VLT90/epochs
GET https://api.volta90.trade/oracle/VLT90/snapshots?sort=asc&limit=1000&from=[epoch-open]&to=[epoch-close]
POST GraphQL PeriodSummary (vault week anchor; indexer endpoint in volta ops docs)
| Check | Value |
|---|---|
| Merged activity (this export) | 3787 timeline events · 169 oracle snapshots in-window |
| Boundary multisig txs (open → close) | 0xecb03fcf11539497b489f377652500af6b20454d4be934e4af85486f1e4d6b7e · 0x57649b1d68a02bfb5d69920aaa31b45dbd946a1b10bfd7671a892d298dd898da |
| Snapshots bookends | _id 6a4243e944bfe240f0cd0679 → 6a4b6e951b18fbc51a111b2a (169 docs) |
What this document is not: not the exchange's internal risk pack; statements follow chronological order on Volta's merged activity feed.