
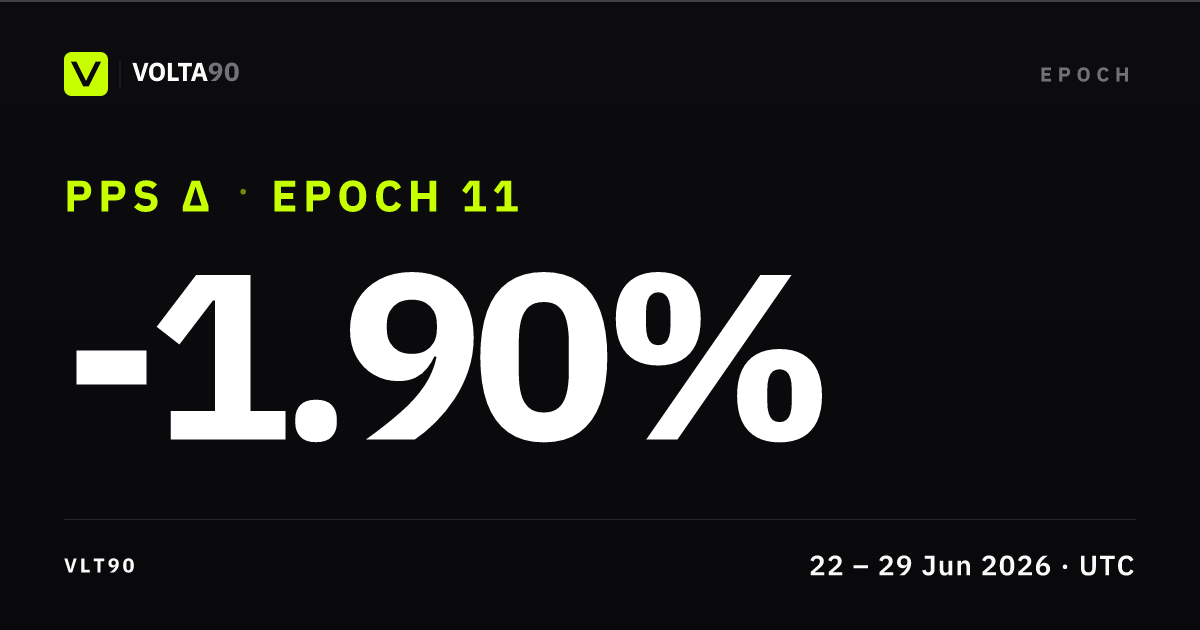
Epoch card
Operator desk note
The week of 22-28 June saw profit-taking on leading tech and AI names, pulling the NASDAQ down roughly 4% over the week. That tape hit Volta's near-term performance given our offensively tilted allocation.
This scenario was anticipated: valuations on AI leaders had run high, which is why the strategy still held over 60% in cash.
Volta's strategy metrics point to a possible broader sector rotation this summer. Financials and health care may benefit short term as capital rotates away from AI semiconductors during profit-taking. That rotation may only be brief.
We will tilt the book toward those lagging sectors at the start of H2 2026, but current platform limits mean we cannot get clean exposure to health and finance sleeves. Allocation to those themes will stay modest, and a meaningful cash share will remain into early July 2026.
Longer term, these mid-cycle corrections do not change the bullish AI trend. We keep prior AI-linked positions and will add on dips.
This week we already made small adds to NASDAQ (XYZ100), gold, and a DRAM ETF tied to AI memory. We remain on the sidelines for crypto; we expect another leg lower before levels look attractive enough to deploy.
Performance
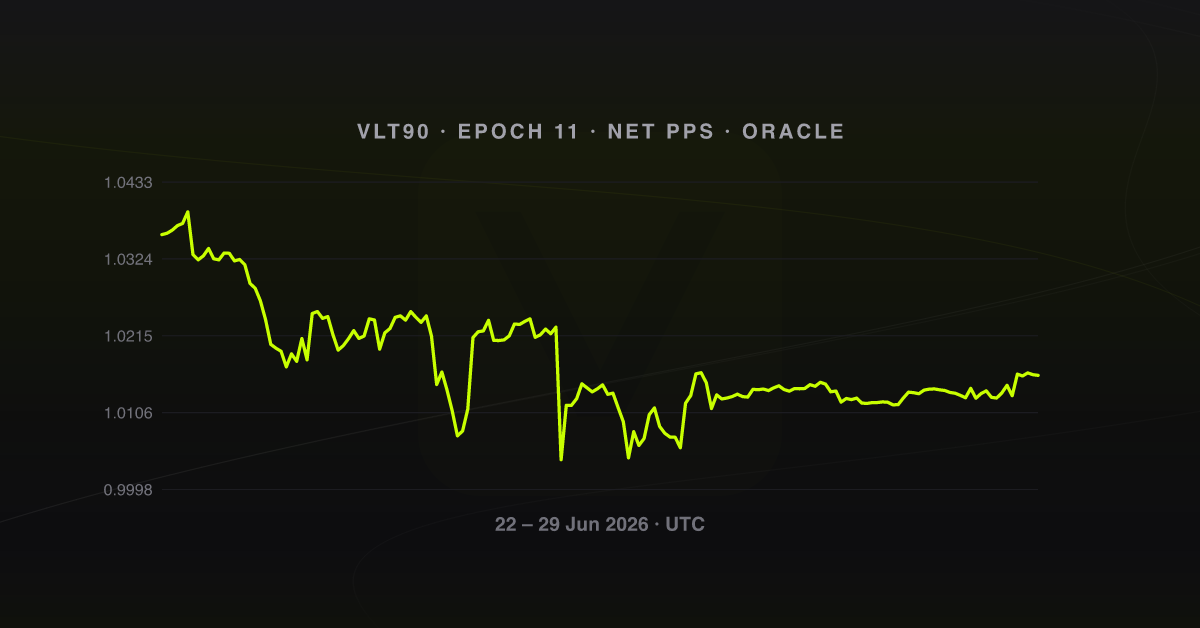
Over 2026-06-22 → 2026-06-29, net share price printed low 1.003962 and high 1.039047. The largest drawdown from a running intra-week high landed at 3.38%. That is the clearest stress point on the path. Volatility showed up in the band: low to high spanned ~3.39% versus week-open net PPS. Into the last tick, PPS sat meaningfully below week open (≈ -1.92%), a soft weekly finish. Open Performance in the app for the same net PPS basis with full zoom.
What drove the week
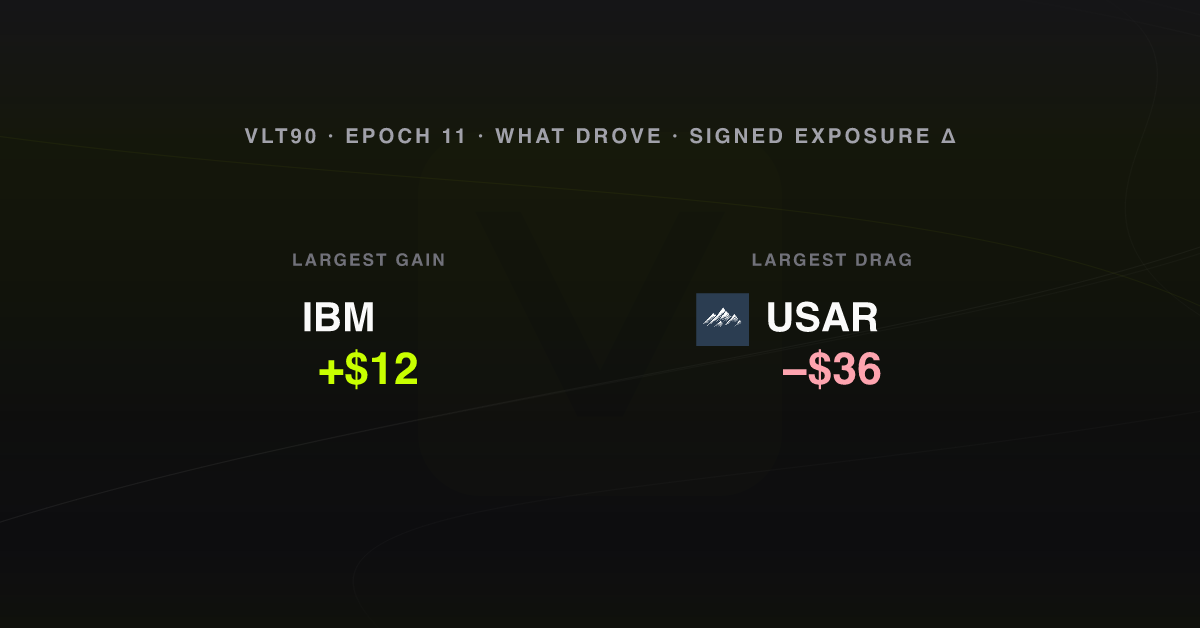
From week-open to week-end oracle snaps (cash sleeves excluded; perps: Δ unrealised P&L; spot: notional), sleeve-level marks moved most in favour of  IBM +$12 and most against
  USAR −$36. Other listed names on the same basis moved:
  URNM −$16,
  SMH −$15,
  CRCL −$13,
  GOLD −$9,
  HYPE −$8,
  HOOD −$8,
  Nasdaq 100 −$7,
  QNT +$6,
  NBIS +$5,
  COPPER −$4, and
  DRAM −$1.
Allocation by asset class & gross exposure
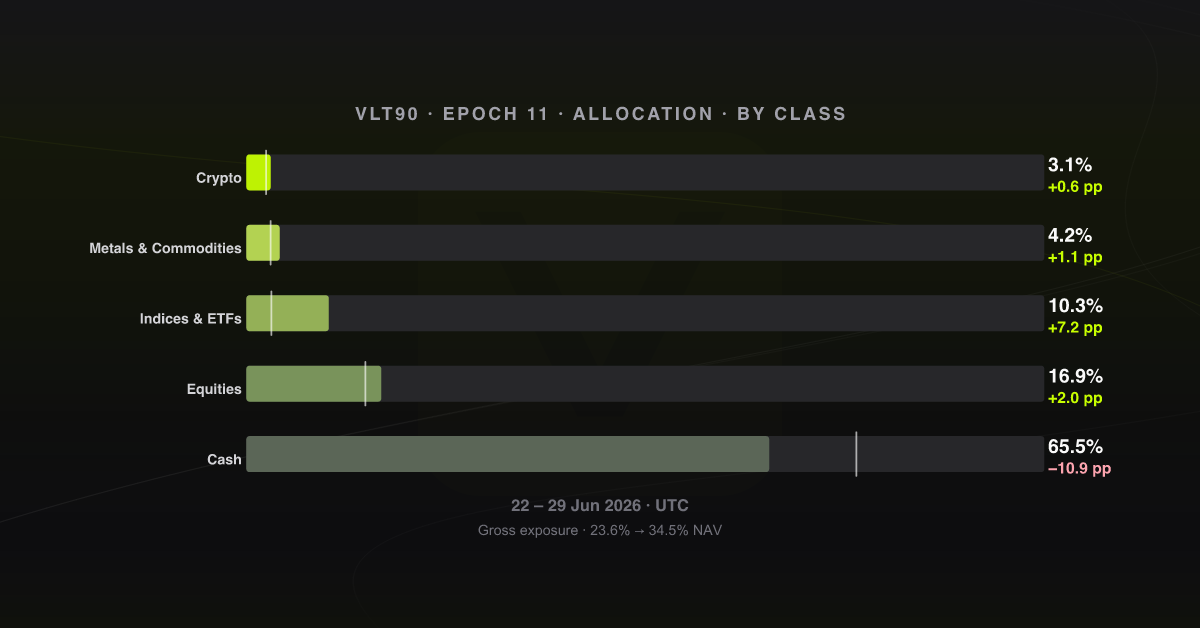
The clearest sleeve moves vs week open are Cash −10.9 pp, Indices & ETFs +7.2 pp, and Equities +2.0 pp. Gross exposure (deployed notional / NAV) moved from 23.6% to 34.5% of NAV. (+10.9 pp on gross exposure vs prior week-end). Same asset-class bands as Allocations (History tab); figures are % of vault NAV.
Listed clips: Hyperliquid
| Time (UTC) | Instrument | Side | Size | Price | Fee | Realised close P&L |
|---|---|---|---|---|---|---|
| 2026-06-22 12:38:18 | HL spot / stable basket | Sell | 1565.9100 | 1.0000 | USDC 0.2105 | - |
| 2026-06-22 12:41:57 | SMH |
Open Long | 0.3040 | 669.6700 | USDC 0.0176 | - |
| 2026-06-22 12:44:57 | URNM |
Open Long | 4.0300 | 57.1400 | USDC 0.0199 | - |
| 2026-06-22 17:13:20 | HOOD |
Open Long | 1.4000 | 107.0800 | USDC 0.0130 | - |
| 2026-06-23 00:00:00 | HL spot / stable basket | Spot Dust Conversion | 0.0025 | 1.0000 | USDC 0.0000 | - |
| 2026-06-23 14:36:30 | DRAM |
Open Long | 2.7000 | 71.7040 | USDC 0.0167 | - |
| 2026-06-23 14:38:03 | QNT |
Close Long | 0.4000 | 79.6160 | USDC 0.0028 | 10.8649 |
| 2026-06-24 03:09:59 | HYPE |
Open Long | 1.2200 | 61.1000 | USDC 0.0107 | - |
| 2026-06-25 08:44:55 | USAR |
Open Long | 2.7100 | 22.0890 | USDC 0.0052 | - |
| 2026-06-25 08:45:43 | CRCL |
Open Long | 0.6890 | 72.5150 | USDC 0.0043 | - |
| 2026-06-25 08:46:26 | COPPER |
Open Long | 13.1200 | 6.0964 | USDC 0.0069 | - |
| 2026-06-25 18:11:27 | Nasdaq 100 |
Open Long | 0.0016 | 29500.0000 | USDC 0.0041 | - |
| 2026-06-26 14:19:42 | HOOD |
Open Long | 0.6990 | 95.8830 | USDC 0.0058 | - |
| 2026-06-26 15:50:26 | NBIS |
Open Long | 0.6200 | 240.6800 | USDC 0.0129 | - |
| 2026-06-26 15:50:52 | GOLD |
Open Long | 0.0122 | 4096.2000 | USDC 0.0432 | - |
| 2026-06-29 07:16:47 | HL spot / stable basket | Sell | 99.9700 | 1.0000 | USDC 0.0140 | -0.0240 |
Realised P&L on closes (what Hyperliquid books when a position is closed):
- QNT +$11, about +34.12% vs the dollar size of that trade (size × price)
- HL spot / stable basket −$0, about -0.02% vs the dollar size of that trade (size × price)
Total from these closes: about +$11, or about +0.10% of the vault’s opening NAV for the week. Trading fees on those fills are not subtracted here.
Appendix - sources & verification
GET https://api.volta90.trade/transactions/VLT90/epoch/11/timeline?full=true
GET https://api.volta90.trade/oracle/VLT90/epochs
GET https://api.volta90.trade/oracle/VLT90/snapshots?sort=asc&limit=1000&from=[epoch-open]&to=[epoch-close]
POST GraphQL PeriodSummary (vault week anchor; indexer endpoint in volta ops docs)
| Check | Value |
|---|---|
| Merged activity (this export) | 3459 timeline events · 170 oracle snapshots in-window |
| Boundary multisig txs (open → close) | 0x920d2a339dd58093d18c4a206576811a1fc14aff8a1f6dcf4eb54fc7a33cfbea · 0xecb03fcf11539497b489f377652500af6b20454d4be934e4af85486f1e4d6b7e |
| Snapshots bookends | _id 6a38f9c44558af75df223345 → 6a424225bf10b60205cd06b5 (170 docs) |
What this document is not: not the exchange's internal risk pack; statements follow chronological order on Volta's merged activity feed.