
Epoch card
Operator desk note
During the week of July 6 to July 11, 2026, the American indices continued their consolidation phase following a strong rebound from early April to late May. Speculative ETFs, such as SMH for semiconductors and DRAM for AI memory, have been fluctuating between correction and lateral movement since early June. For instance, SMH is currently at the same price level as it was on May 27, while DRAM experienced a 28% decline between June 22 and July 8. These movements highlight the inherent volatility when investing in trending sectors.
Volta's strategy remains moderately invested in its most speculative assets, acknowledging the rapid rise since April. It was deemed prudent to wait for the initial frenzy to subside before re-entering and deploying additional cash. We believe this strategic period is nearing, and we are gradually increasing exposure, particularly in semiconductors, AI memory, and underperforming sectors like robotics and quantum technology this year.
Exposures to instruments like BOT for robotics and QNT for quantum will be incrementally reinforced in the coming weeks, provided the market establishes a weekly low. Simultaneously, our strategy will maintain its diversified approach, building positions in finance, health, and brokerage sectors, with examples including LLY and CRCL. Additionally, we plan to gradually strengthen our precious metals holdings following significant corrections in this market segment since the beginning of the year.
We remain confident that the overarching AI-driven growth cycle is far from over. Innovation cycles can now permeate the broader economy more swiftly, necessitating speculative bets on assets poised for appreciation in the near future. However, this approach requires accepting a potentially higher NAV volatility in the coming periods.
Performance
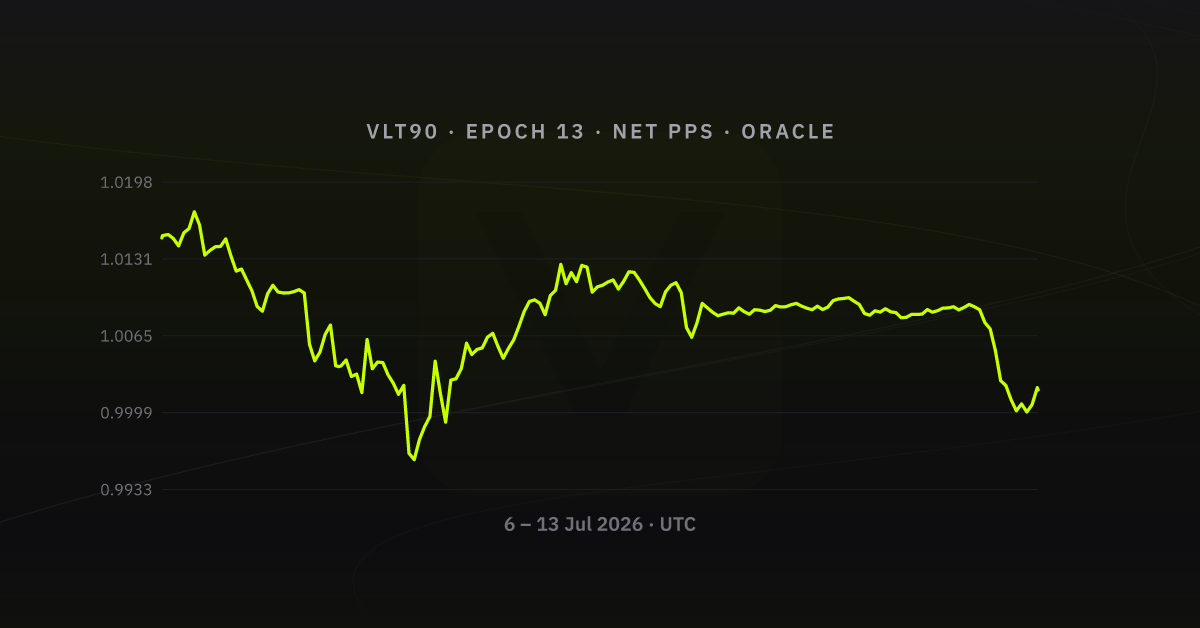
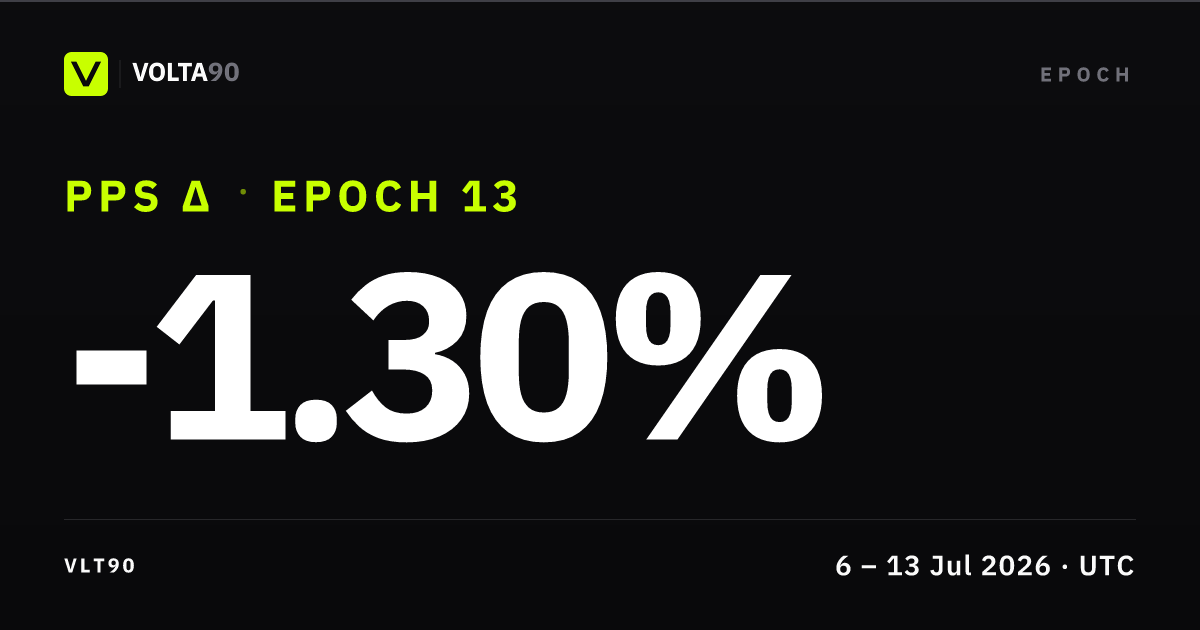
Over 2026-07-06 → 2026-07-13, net share price printed low 0.995818 and high 1.017213. The largest drawdown from a running intra-week high landed at 2.10%. That is the clearest stress point on the path. The low-to-high band was ~2.11% off week open, a normal swing week, not a flat line. Into the last tick, PPS sat meaningfully below week open (≈ -1.29%), a soft weekly finish. Open Performance in the app for the same net PPS basis with full zoom.
What drove the week
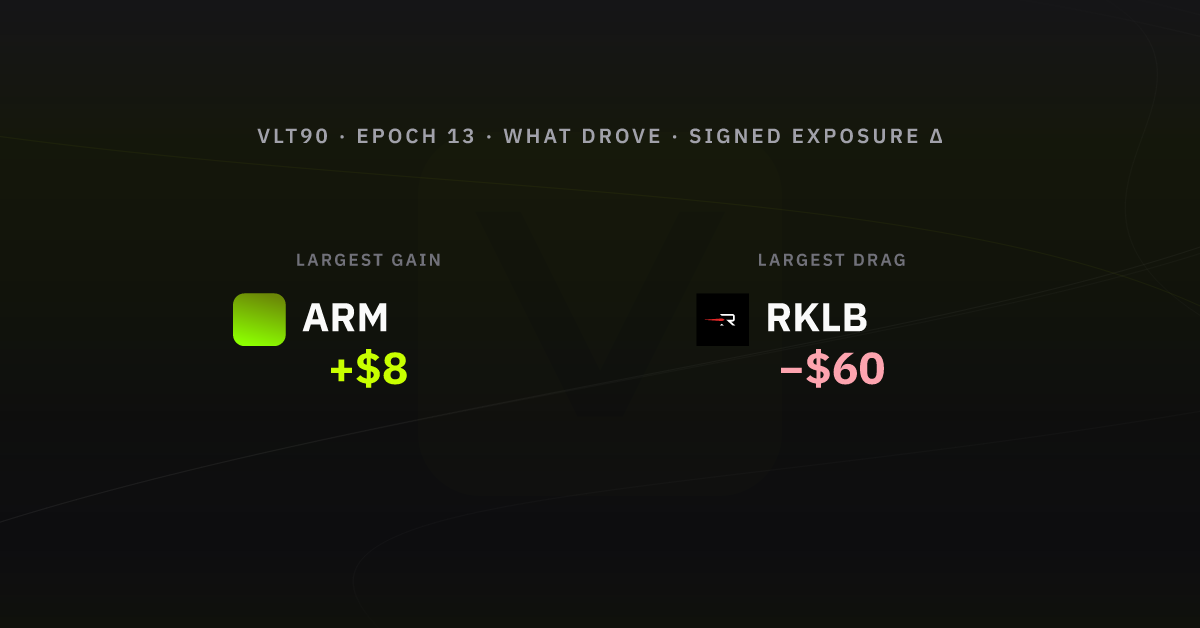
From week-open to week-end oracle snaps (cash sleeves excluded; perps: Δ unrealised P&L; spot: notional), sleeve-level marks moved most in favour of  ARM +$8 and most against
  RKLB −$60. Other listed names on the same basis moved:
  BOT −$39,
  DRAM −$35,
  HIMS −$21,
  USAR −$21,
  MRVL −$19,
  NBIS −$13,
  CRCL −$12,
  QNT −$11,
  GOLD −$3,
  SMH +$3,
  SNDK −$2,
  NOK −$2, and
  Nasdaq 100 +$1.
Allocation by asset class & gross exposure
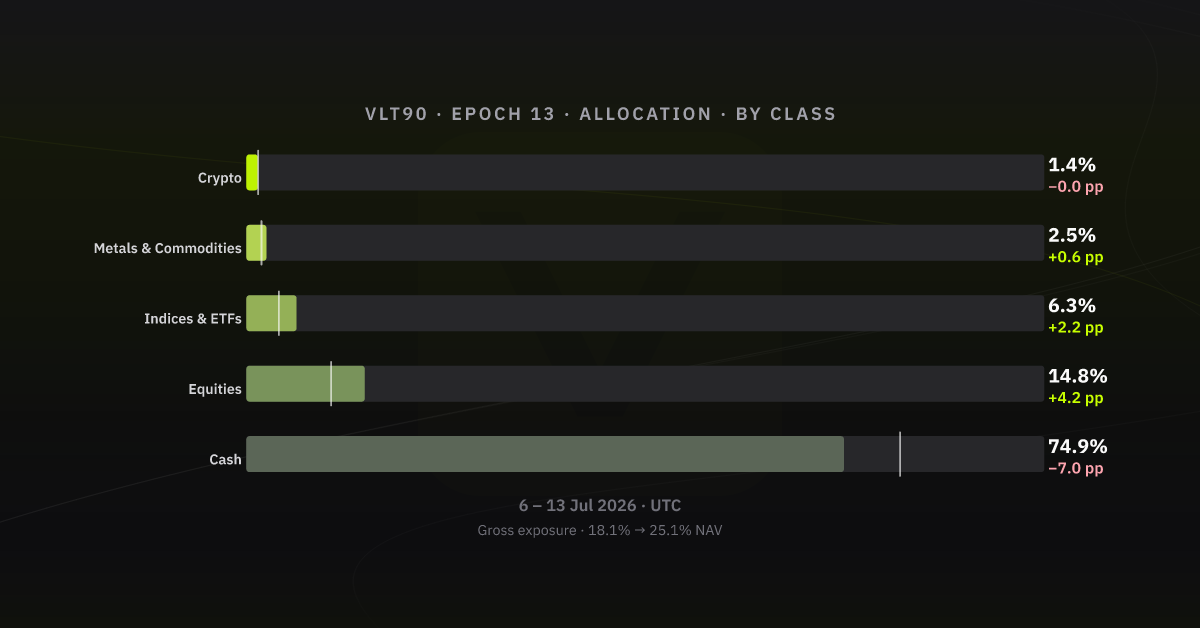
The clearest sleeve moves vs week open are Cash −7.0 pp, Equities +4.2 pp, and Indices & ETFs +2.2 pp. Gross exposure (deployed notional / NAV) moved from 18.1% to 25.1% of NAV. (-4.7 pp on gross exposure vs prior week-end). Same asset-class bands as Allocations (History tab); figures are % of vault NAV.
Listed clips: Hyperliquid
| Time (UTC) | Instrument | Side | Size | Price | Fee | Realised close P&L |
|---|---|---|---|---|---|---|
| 2026-07-06 16:07:20 | BOT |
Open Long | 4.9500 | 40.4119 | USDC 0.0180 | - |
| 2026-07-06 16:09:08 | SNDK |
Open Long | 0.0820 | 1811.6000 | USDC 0.0134 | - |
| 2026-07-06 16:11:36 | NBIS |
Open Long | 0.6800 | 220.2600 | USDC 0.0135 | - |
| 2026-07-06 16:13:13 | CRCL |
Open Long | 1.4360 | 69.6280 | USDC 0.0090 | - |
| 2026-07-06 16:14:07 | NOK |
Open Long | 11.9200 | 12.5930 | USDC 0.0135 | - |
| 2026-07-06 18:55:28 | HIMS |
Open Long | 5.2600 | 38.0100 | USDC 0.0060 | - |
| 2026-07-07 18:52:57 | ARM |
Open Long | 0.5000 | 298.7700 | USDC 0.0134 | - |
| 2026-07-07 18:55:37 | Nasdaq 100 |
Open Long | 0.0051 | 29190.0000 | USDC 0.0134 | - |
| 2026-07-07 18:57:09 | GOLD |
Open Long | 0.0363 | 4131.6000 | USDC 0.1350 | - |
| 2026-07-07 18:58:30 | SMH |
Open Long | 0.2590 | 578.1400 | USDC 0.0135 | - |
| 2026-07-08 08:19:40 | GOLD |
Close Long | 0.0100 | 4093.8000 | USDC 0.0354 | -3.0749 |
| 2026-07-08 08:20:16 | GOLD |
Open Long | 0.0100 | 4098.4000 | USDC 0.0369 | - |
| 2026-07-10 10:07:01 | USAR |
Open Long | 7.9000 | 19.0050 | USDC 0.0135 | - |
| 2026-07-10 10:08:06 | DRAM |
Open Long | 1.6000 | 62.4000 | USDC 0.0090 | - |
| 2026-07-10 10:11:47 | QNT |
Close Long | 0.1600 | 74.2380 | USDC 0.0010 | 3.4855 |
| 2026-07-10 10:13:43 | MRVL |
Open Long | 0.5000 | 239.7500 | USDC 0.0108 | - |
Realised P&L on closes (what Hyperliquid books when a position is closed):
- QNT +$3, about +29.34% vs the dollar size of that trade (size × price)
- GOLD −$3, about -7.51% vs the dollar size of that trade (size × price)
Total from these closes: about +$0, or about +0.00% of the vault’s opening NAV for the week. Trading fees on those fills are not subtracted here.
Appendix - sources & verification
GET https://api.volta90.trade/transactions/VLT90/epoch/13/timeline?full=true
GET https://api.volta90.trade/oracle/VLT90/epochs
GET https://api.volta90.trade/oracle/VLT90/snapshots?sort=asc&limit=1000&from=[epoch-open]&to=[epoch-close]
POST GraphQL PeriodSummary (vault week anchor; indexer endpoint in volta ops docs)
| Check | Value |
|---|---|
| Merged activity (this export) | 5635 timeline events · 172 oracle snapshots in-window |
| Boundary multisig txs (open → close) | 0x57649b1d68a02bfb5d69920aaa31b45dbd946a1b10bfd7671a892d298dd898da · 0x153c3e366611fd21b5e24566e59607cd50562f4a013979fc6261faa64775b67f |
| Snapshots bookends | _id 6a4b79e78539dba642111505 → 6a54ab53fd1562564b208394 (172 docs) |
What this document is not: not the exchange's internal risk pack; statements follow chronological order on Volta's merged activity feed.