
Epoch card
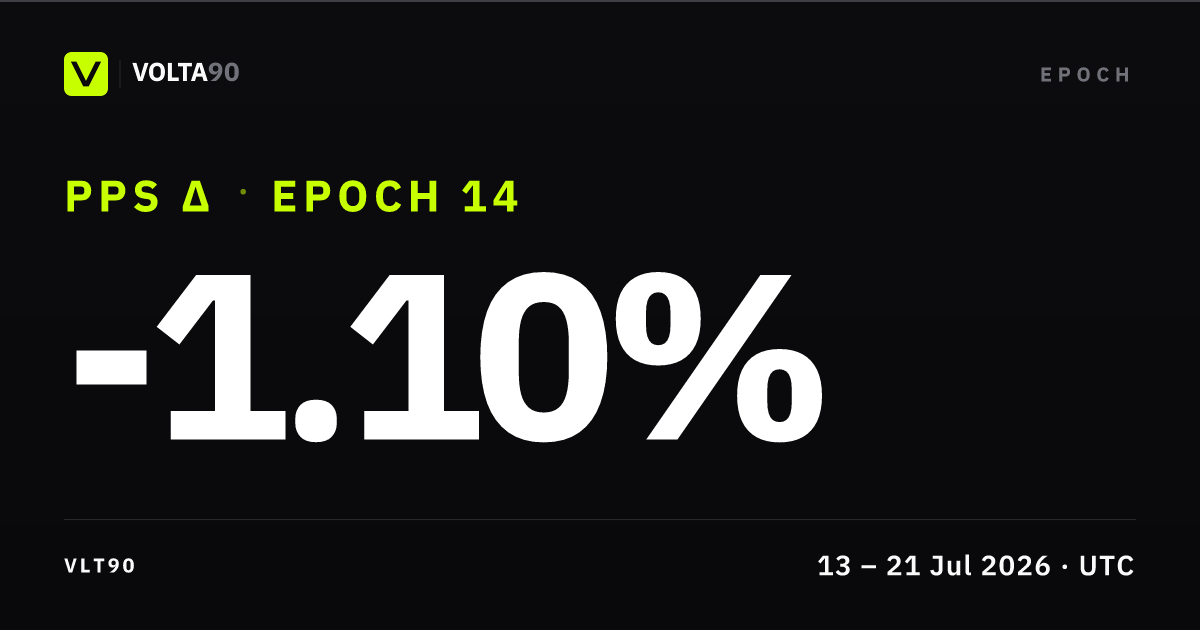
Operator desk note
The week of July 13 to 19 was particularly brutal for so-called risk assets, especially U.S. equities in semiconductors and artificial intelligence.
The semiconductor index SMH is now technically in a bear market, down more than 20% from its highs. Some names in AI memory or NeoCloud show declines of more than 30%, and in places more than 40%, from their peaks.
Against a backdrop of stress in the South Korean market, with a cluster of over-leveraged participants, we saw a sharp short-term repricing of the AI complex. That pressure weighs on the Nasdaq, but only modestly on the S&P 500 for now, which is more diversified.
In that setting, the Volta strategy posted a down week, but it had already flagged a possible complication in these speculative sleeves - which is why barely a quarter of available cash is deployed in the market today. The drawdown on the portfolio is therefore largely contained.
We remain on the hunt for opportunities. The indicators that steer Volta may give buy points on the current weakness in AI-linked stocks and sectors for medium-term positioning. In the near term, though, there are still no convincing reversal signals, and the risk of further downside remains.
By the end of July we should therefore put a few additional cash lines to work in carefully chosen names. The strategy will wait for clearer signals from its indicators before sizing the larger lines and raising the Volta portfolio’s market exposure.
Performance
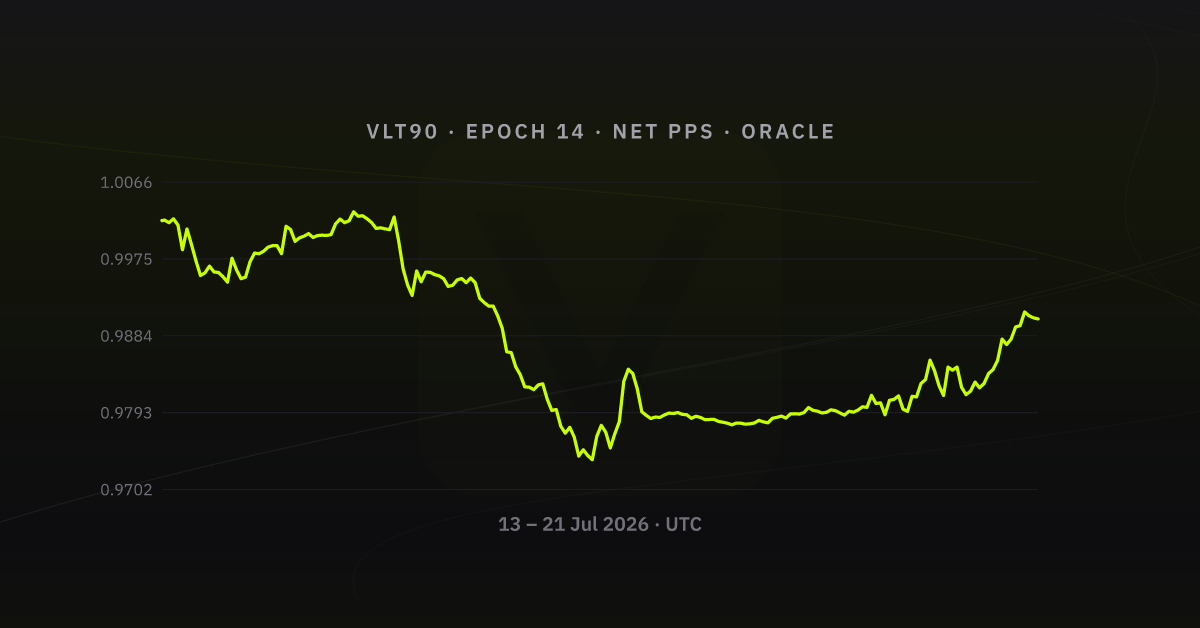
Over 2026-07-13 → 2026-07-21, net share price printed low 0.973771 and high 1.003114. The largest drawdown from a running intra-week high landed at 2.93%. That is the clearest stress point on the path. Volatility showed up in the band: low to high spanned ~2.93% versus week-open net PPS. Into the last tick, PPS sat meaningfully below week open (≈ -1.16%), a soft weekly finish. Open Performance in the app for the same net PPS basis with full zoom.
What drove the week
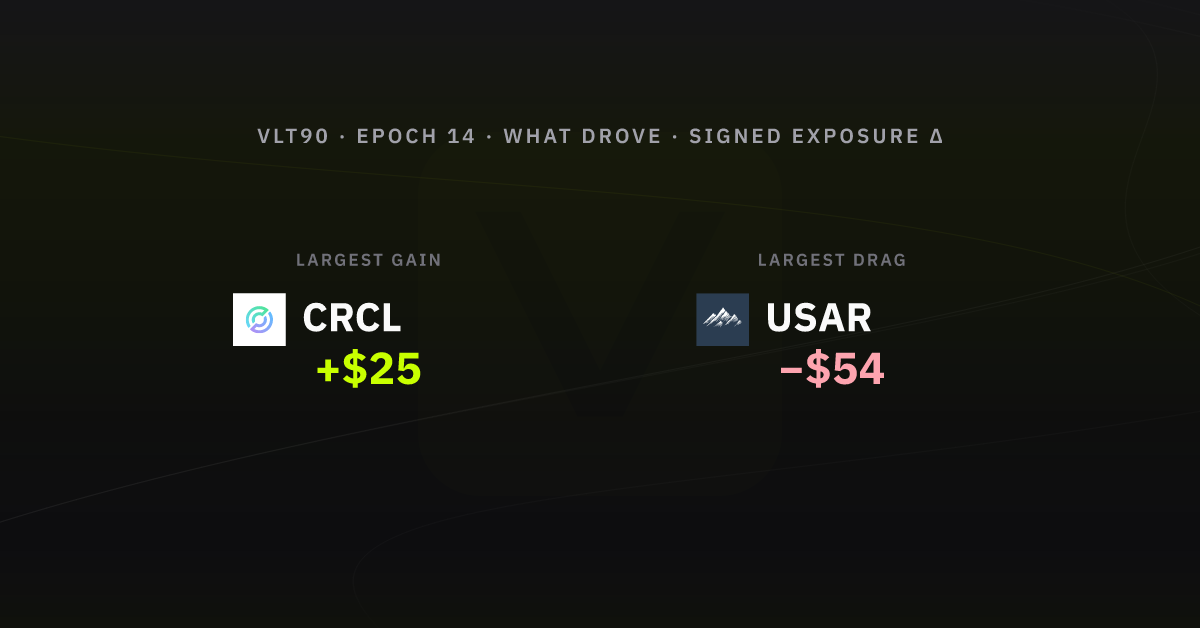
From week-open to week-end oracle snaps (cash sleeves excluded; perps: Δ unrealised P&L; spot: notional), sleeve-level marks moved most in favour of  CRCL +$25 and most against
  USAR −$54. Other listed names on the same basis moved:
  ARM −$17,
  SNDK −$14,
  COIN +$10,
  HIMS −$10,
  NBIS −$10,
  SMH −$9,
  GOOGL −$2, and
  DRAM +$2.
Allocation by asset class & gross exposure
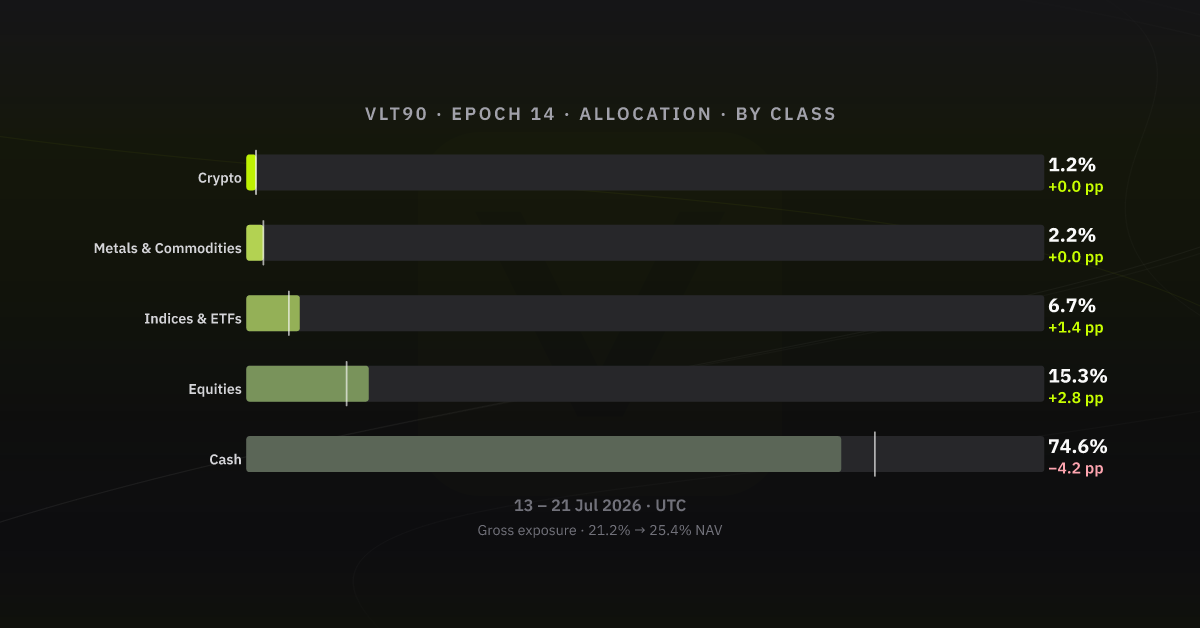
The clearest sleeve moves vs week open are Cash −4.2 pp, Equities +2.8 pp, and Indices & ETFs +1.4 pp. Gross exposure (deployed notional / NAV) moved from 21.2% to 25.4% of NAV. (+0.4 pp on gross exposure vs prior week-end). Same asset-class bands as Allocations (History tab); figures are % of vault NAV.
Listed clips: Hyperliquid
| Time (UTC) | Instrument | Side | Size | Price | Fee | Realised close P&L |
|---|---|---|---|---|---|---|
| 2026-07-13 11:14:45 | COIN |
Open Long | 1.2700 | 157.4300 | USDC 0.0180 | - |
| 2026-07-13 11:15:39 | DRAM |
Open Long | 1.8000 | 57.6680 | USDC 0.0093 | - |
| 2026-07-15 10:13:27 | CRCL |
Open Long | 1.7110 | 63.6920 | USDC 0.0098 | - |
| 2026-07-15 10:14:27 | ARM |
Open Long | 0.3700 | 284.6300 | USDC 0.0095 | - |
| 2026-07-15 10:14:53 | HIMS |
Open Long | 1.7700 | 35.5850 | USDC 0.0057 | - |
| 2026-07-15 10:17:03 | GOOGL |
Open Long | 0.4180 | 358.2900 | USDC 0.0135 | - |
| 2026-07-16 17:11:06 | SMH |
Open Long | 0.3510 | 569.9583 | USDC 0.0180 | - |
| 2026-07-16 17:11:25 | SNDK |
Open Long | 0.0560 | 1447.1000 | USDC 0.0073 | - |
| 2026-07-16 17:12:48 | USAR |
Open Long | 4.7200 | 15.8990 | USDC 0.0068 | - |
| 2026-07-16 20:09:47 | DRAM |
Open Long | 2.3000 | 52.2940 | USDC 0.0108 | - |
| 2026-07-17 15:05:35 | NBIS |
Open Long | 0.7300 | 176.6900 | USDC 0.0116 | - |
| 2026-07-17 15:06:01 | SNDK |
Open Long | 0.0770 | 1395.1000 | USDC 0.0097 | - |
Realised P&L on closes. Nothing in the table above is a closing trade with booked profit or loss. Only opens, adds, or spot legs.
Appendix - sources & verification
GET https://api.volta90.trade/transactions/VLT90/epoch/14/timeline?full=true
GET https://api.volta90.trade/oracle/VLT90/epochs
GET https://api.volta90.trade/oracle/VLT90/snapshots?sort=asc&limit=1000&from=[epoch-open]&to=[epoch-close]
POST GraphQL PeriodSummary (vault week anchor; indexer endpoint in volta ops docs)
| Check | Value |
|---|---|
| Merged activity (this export) | 7386 timeline events (merge capped at 5 000 rows for the export - mostly funding ticks; all consolidated fills retained) · 197 oracle snapshots in-window |
| Boundary multisig txs (open → close) | 0x153c3e366611fd21b5e24566e59607cd50562f4a013979fc6261faa64775b67f · 0xd3dd33f0f9ad6cfb0316d7d8960e452504c6ccee99a7014a014ffca75c37f1e8 |
| Snapshots bookends | _id 6a54af13fd1562564b208396 → 6a5f5f44f0897d04a52091c7 (197 docs) |
What this document is not: not the exchange's internal risk pack; statements follow chronological order on Volta's merged activity feed.