
Epoch card
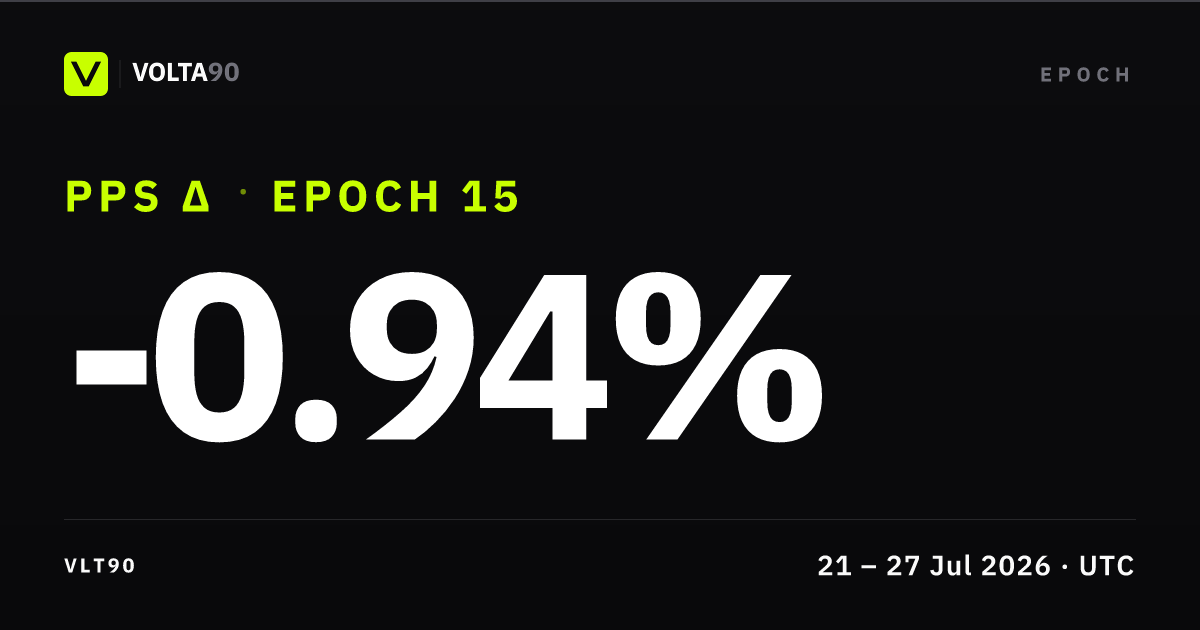
Operator desk note
During the week of July 20 to July 26, 2026, there was a significant decline in risk assets, especially U.S. equities. This downturn is part of a broader bearish trend that has been ongoing since early June. Notably, the main NASDAQ ETF broke through a significant support level on Friday, July 24, yet there was no marked acceleration in the decline following this breach.
Momentum strategies have faced one of their most substantial setbacks in years, with severe declines over the past six weeks. Sector-specific ETFs and individual stocks, particularly in growth sectors such as semiconductors, AI memory intelligence, robotics, and space, have seen drops of 40% to over 50%. These substantial profit-taking moves, while possibly justified by a precarious geopolitical climate, appear disconnected from company fundamentals and recent earnings metrics, which remain stable or positive.
Volta's strategy had anticipated potential market difficulties, given the sharp increases in AI stocks during April and May. Consequently, only a modest cash reserve was deployed. The portfolio is now well-positioned to deploy capital, as the lack of continued decline following the NASDAQ support breach could signal the end of the bearish trend. This presents a strategic opportunity to position in Momentum stocks, which are expected to drive future performance, pending further confirmation from U.S. index price action.
Particular attention will be given to reinforcing positions in semiconductor, Neocloud, and robotics sectors, as these areas are poised for potential recovery and growth.
Performance
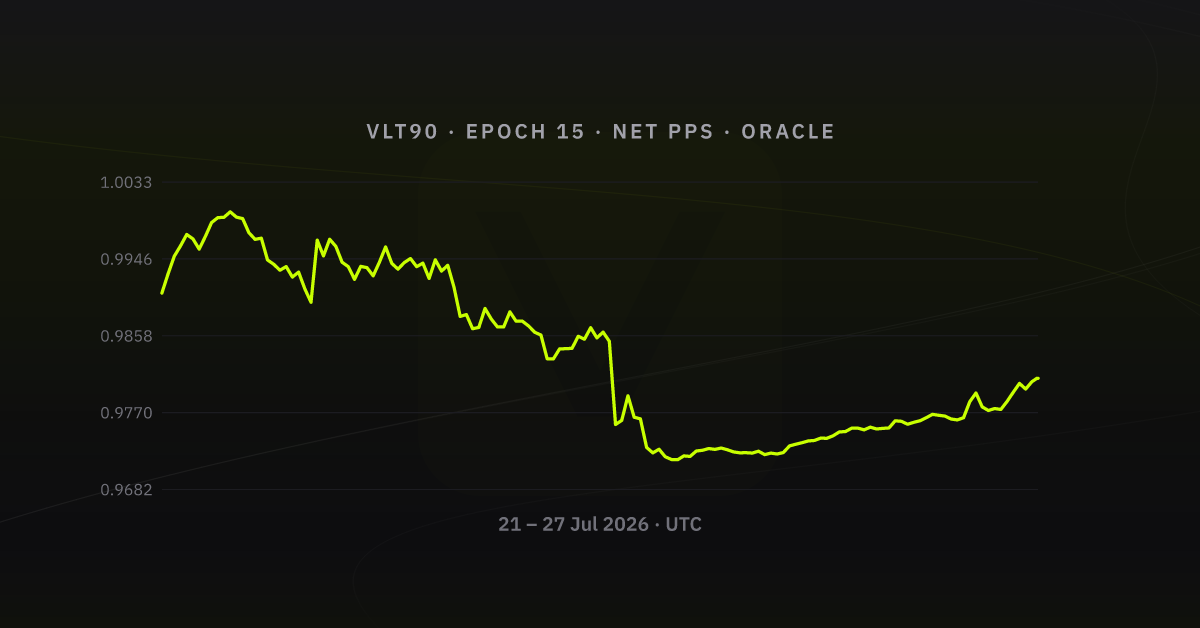
Over 2026-07-21 → 2026-07-27, net share price printed low 0.971645 and high 0.999942. The largest drawdown from a running intra-week high landed at 2.83%. That is the clearest stress point on the path. Volatility showed up in the band: low to high spanned ~2.86% versus week-open net PPS. Into the last tick, PPS sat meaningfully below week open (≈ -0.98%), a soft weekly finish. Open Performance in the app for the same net PPS basis with full zoom.
What drove the week
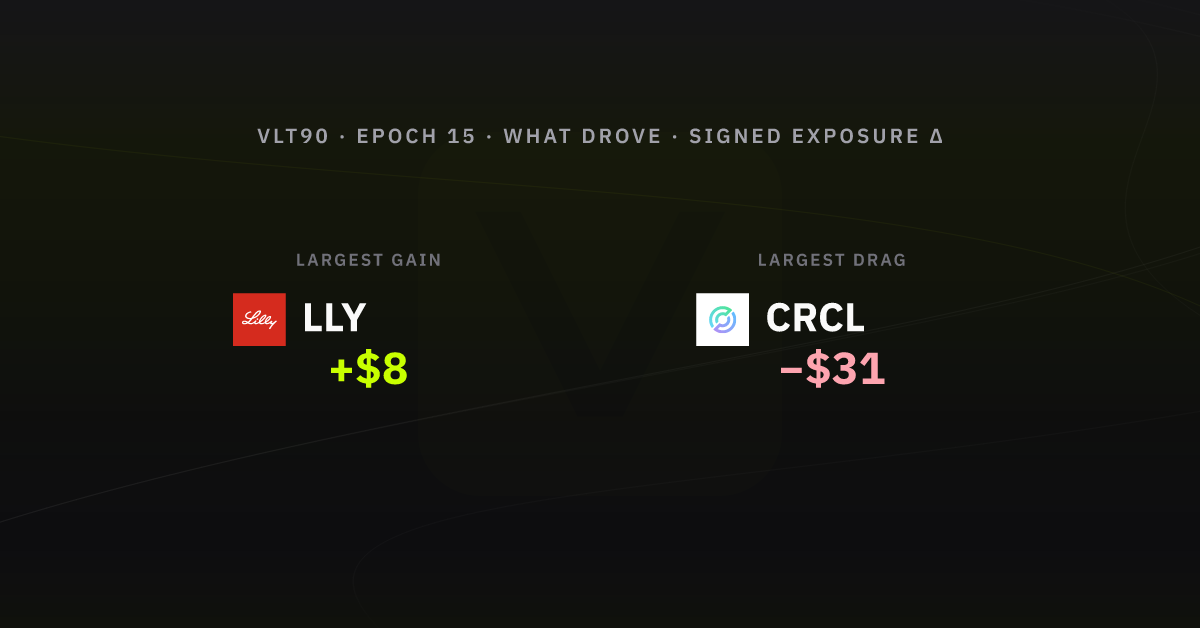
From week-open to week-end oracle snaps (cash sleeves excluded; perps: Δ unrealised P&L; spot: notional), sleeve-level marks moved most in favour of  LLY +$8 and most against
  CRCL −$31. Other listed names on the same basis moved:
  NOK −$27,
  USAR −$27,
  GOOGL −$18,
  HOOD −$17,
  RKLB −$16,
  Nasdaq 100 −$9,
  DRAM −$6,
  MRVL −$5,
  LITE −$1, and
  SMH −$0.
Allocation by asset class & gross exposure
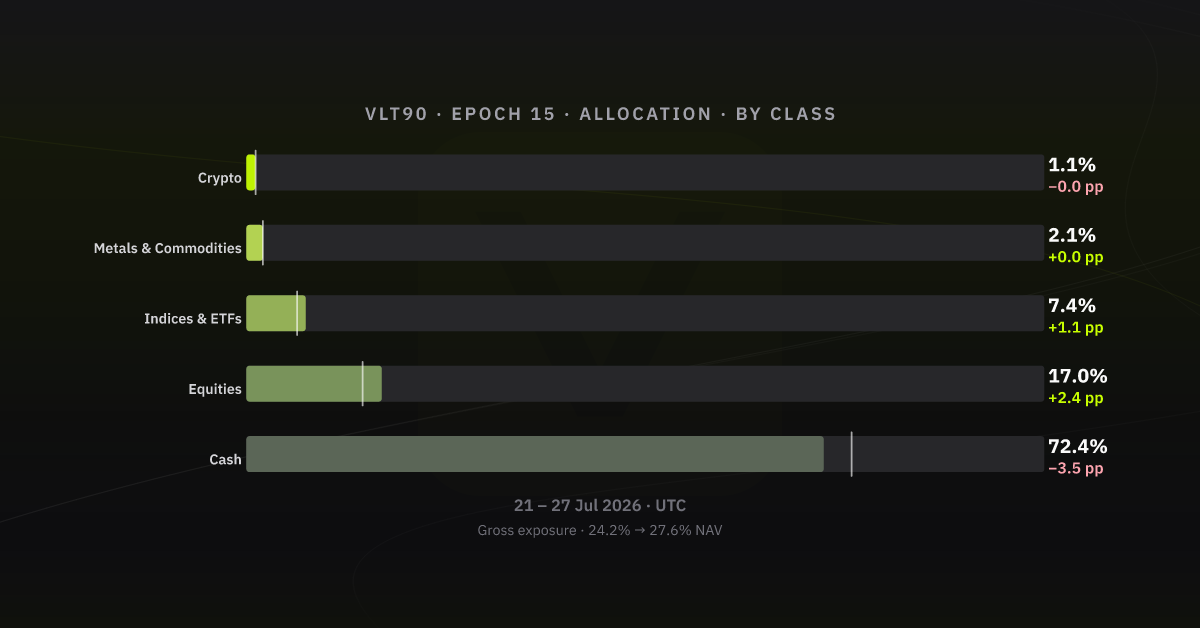
The clearest sleeve moves vs week open are Cash −3.5 pp, Equities +2.4 pp, and Indices & ETFs +1.1 pp. Gross exposure (deployed notional / NAV) moved from 24.2% to 27.6% of NAV. (+2.2 pp on gross exposure vs prior week-end). Same asset-class bands as Allocations (History tab); figures are % of vault NAV.
Listed clips: Hyperliquid
| Time (UTC) | Instrument | Side | Size | Price | Fee | Realised close P&L |
|---|---|---|---|---|---|---|
| 2026-07-22 09:05:24 | NOK |
Open Long | 11.8500 | 10.5560 | USDC 0.0113 | - |
| 2026-07-22 09:06:24 | DRAM |
Open Long | 1.3000 | 56.9010 | USDC 0.0067 | - |
| 2026-07-22 09:07:15 | GOOGL |
Open Long | 0.2970 | 349.6100 | USDC 0.0093 | - |
| 2026-07-22 09:07:34 | MRVL |
Open Long | 0.7300 | 203.7900 | USDC 0.0134 | - |
| 2026-07-22 09:07:54 | USAR |
Open Long | 6.3100 | 15.8440 | USDC 0.0090 | - |
| 2026-07-22 09:08:24 | SMH |
Open Long | 0.1740 | 573.5600 | USDC 0.0090 | - |
| 2026-07-22 09:09:10 | RKLB |
Open Long | 2.0700 | 72.3240 | USDC 0.0135 | - |
| 2026-07-22 09:11:00 | Nasdaq 100 |
Open Long | 0.0051 | 28985.0000 | USDC 0.0133 | - |
| 2026-07-22 09:12:44 | HOOD |
Open Long | 0.9420 | 106.0600 | USDC 0.0090 | - |
| 2026-07-24 14:17:24 | LITE |
Open Long | 0.1930 | 775.0000 | USDC 0.0045 | - |
Realised P&L on closes. Nothing in the table above is a closing trade with booked profit or loss. Only opens, adds, or spot legs.
Appendix - sources & verification
GET https://api.volta90.trade/transactions/VLT90/epoch/15/timeline?full=true
GET https://api.volta90.trade/oracle/VLT90/epochs
GET https://api.volta90.trade/oracle/VLT90/snapshots?sort=asc&limit=1000&from=[epoch-open]&to=[epoch-close]
POST GraphQL PeriodSummary (vault week anchor; indexer endpoint in volta ops docs)
| Check | Value |
|---|---|
| Merged activity (this export) | 5730 timeline events · 143 oracle snapshots in-window |
| Boundary multisig txs (open → close) | 0xd3dd33f0f9ad6cfb0316d7d8960e452504c6ccee99a7014a014ffca75c37f1e8 · 0xd2054d3c333fa3b0d216f0169173db17ce9d65f09aa25a81798388de9137fc24 |
| Snapshots bookends | _id 6a5f6d55f0897d04a52091d5 → 6a672c24c017ba5545586b3f (143 docs) |
What this document is not: not the exchange's internal risk pack; statements follow chronological order on Volta's merged activity feed.