
Epoch card
Operator desk note
The week from July 27 to August 2, 2026, was marked by significant volatility, largely due to the liquidation of the Situational Awareness fund managed by Leopold Aschenbrenner. This fund, led by a former OpenAI employee with a notable social media presence, was heavily invested in AI semiconductor stocks. Although not confirmed, it appears that certain assets were aggressively sold, forcing the fund to liquidate its holdings at particularly low prices. Citadel was among the buyers during this sell-off. This event likely marks a short-term low for momentum stocks related to AI and semiconductors.
Simultaneously, geopolitical tensions showed signs of easing with the anticipated reopening of the Strait of Hormuz, leading to a drop in WTI oil prices to around $80 at the start of August. In the bond market, interest rate concerns persisted, but Kevin Warsh's decision on July 29 to maintain the Federal Reserve's rates, along with a coordinated intervention in the dollar/yen currency market by the Japanese and U.S. administrations, temporarily alleviated some of these pressures.
In this environment, Volta has continued its strategy of deploying available cash, prioritizing investments in momentum stocks that have been significantly impacted by recent declines. This includes pure semiconductor players, NeoCloud companies, and hyperscalers. The cash deployment could reach up to 50% in the coming trading sessions. We recommend executing these operations progressively, as tensions in Asian markets, particularly the South Korean Kospi, have not completely subsided.
Additionally, we observe ongoing intersectoral rotation, with notable differences in flows between AI momentum stocks and other sectors such as healthcare, finance, and cryptocurrencies. Finance/brokerage stocks and Bitcoin experienced less volatility last week. They did not suffer as much from the downturn but also did not benefit from the late-week rebound focused on semiconductors. Therefore, we remain neutral on this portion of the portfolio for now.
Performance
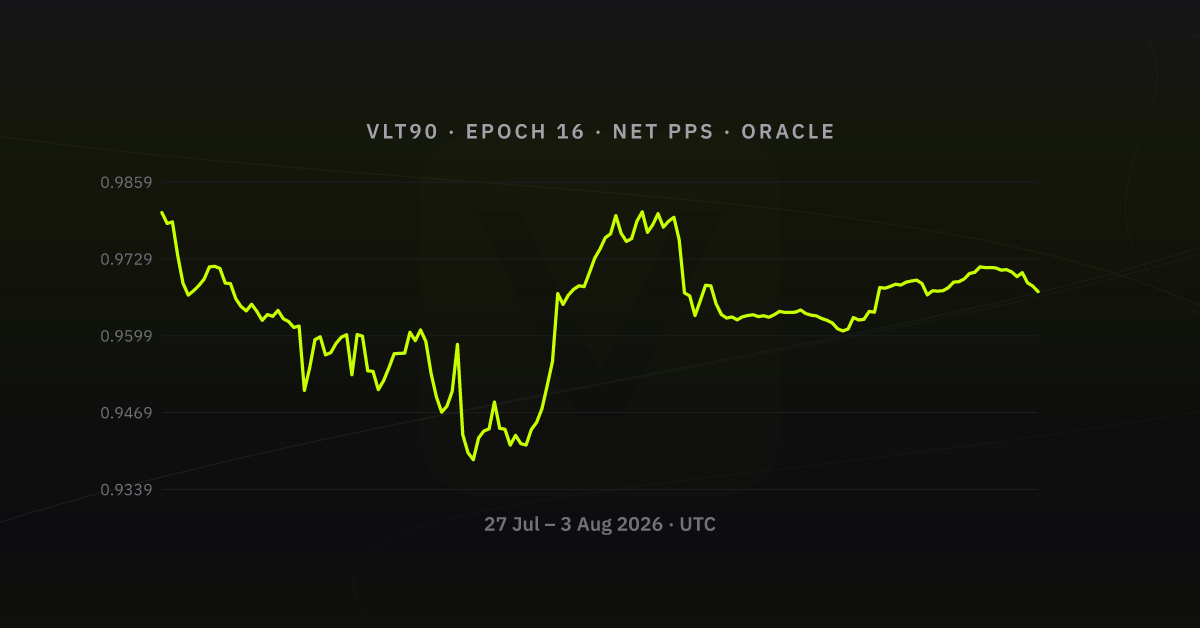
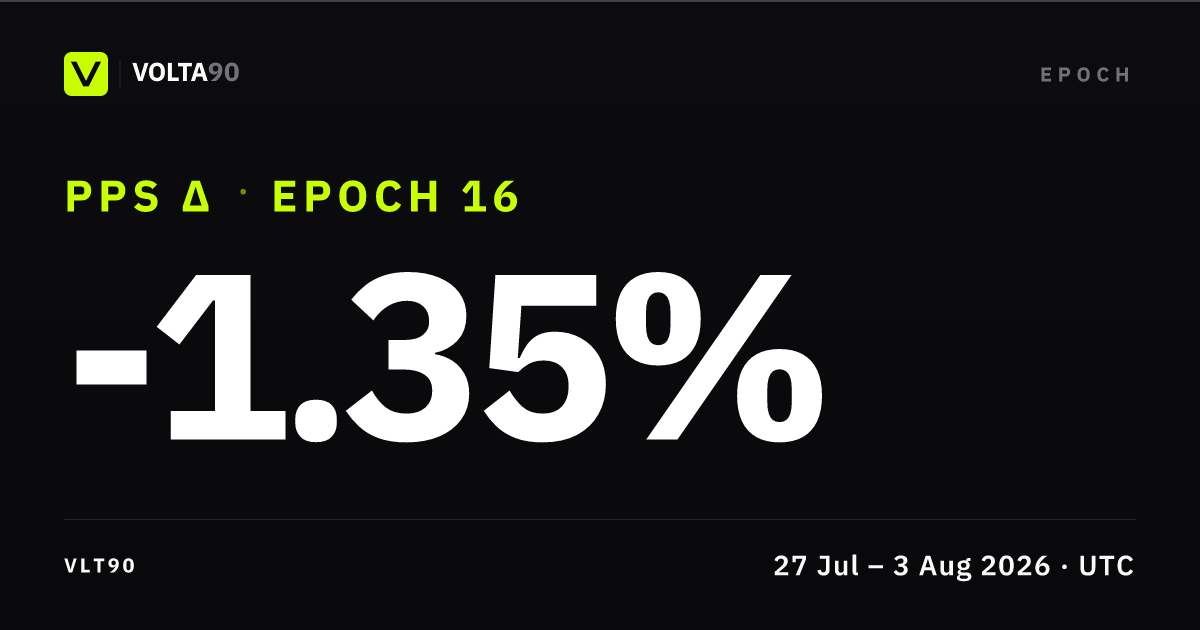
Over 2026-07-27 → 2026-08-03, net share price printed low 0.938975 and high 0.980848. The largest drawdown from a running intra-week high landed at 4.26%. That is the clearest stress point on the path. Volatility showed up in the band: low to high spanned ~4.27% versus week-open net PPS. Into the last tick, PPS sat meaningfully below week open (≈ -1.36%), a soft weekly finish. Open Performance in the app for the same net PPS basis with full zoom.
What drove the week
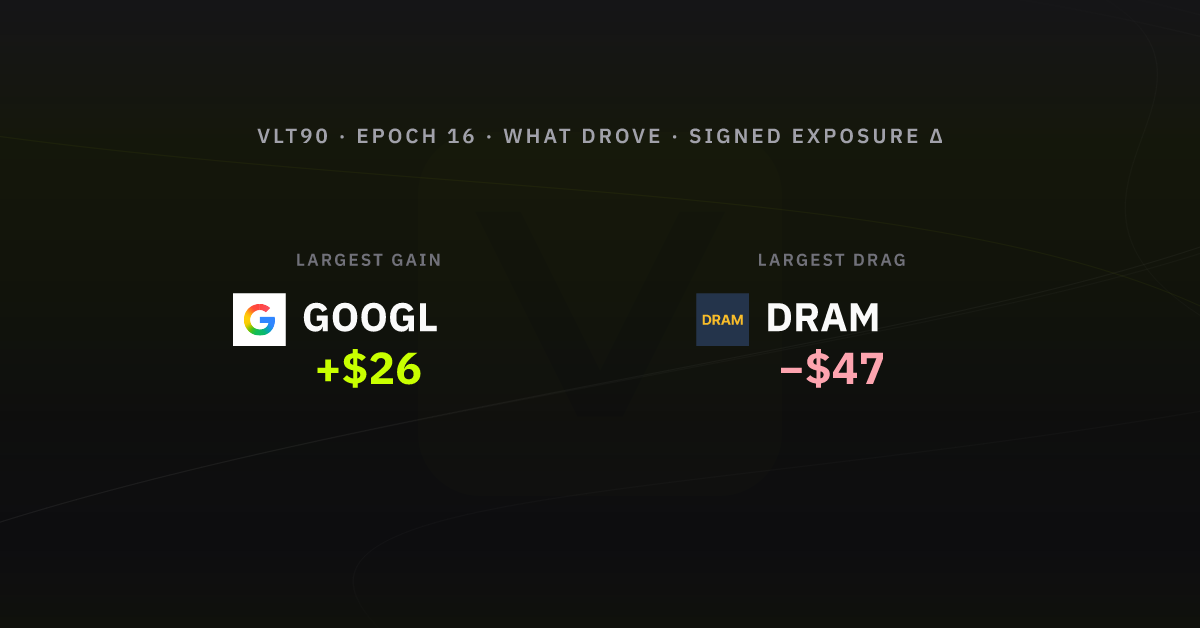
From week-open to week-end oracle snaps (cash sleeves excluded; perps: Δ unrealised P&L; spot: notional), sleeve-level marks moved most in favour of  GOOGL +$26 and most against
  DRAM −$47. Other listed names on the same basis moved:
  SNDK −$41,
  HOOD −$39,
  SMH −$37,
  LITE −$24,
  COPPER +$10,
  NBIS +$5,
  GOLD −$3, and
  Nasdaq 100 +$1.
Allocation by asset class & gross exposure
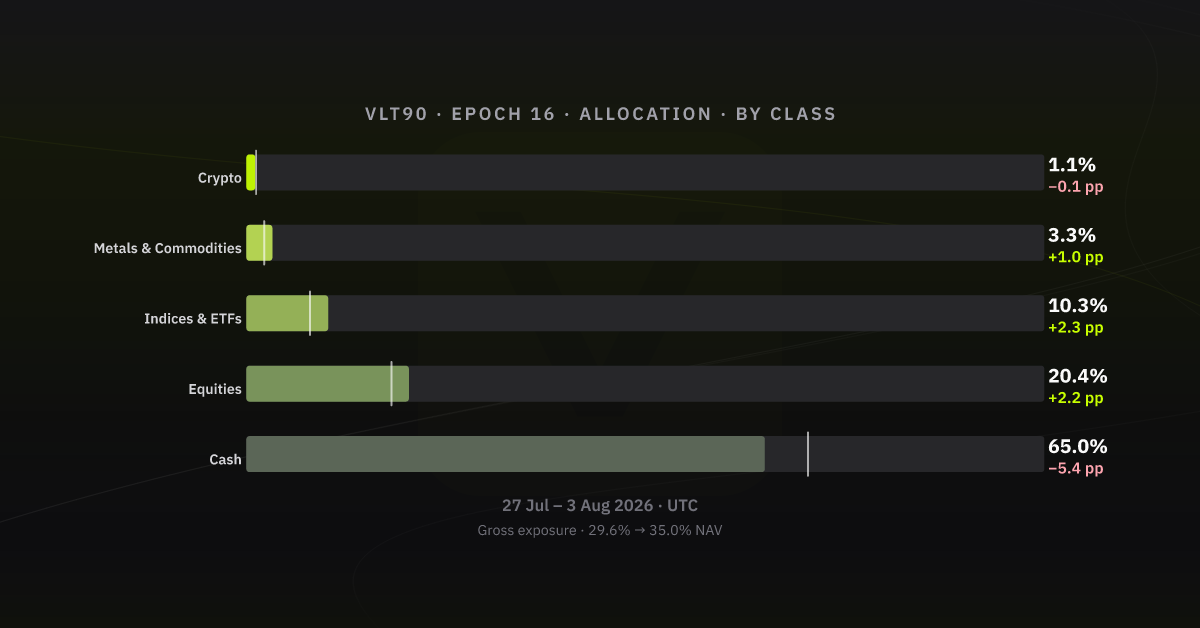
The clearest sleeve moves vs week open are Cash −5.4 pp, Indices & ETFs +2.3 pp, and Equities +2.2 pp. Gross exposure (deployed notional / NAV) moved from 29.6% to 35.0% of NAV. (+7.4 pp on gross exposure vs prior week-end). Same asset-class bands as Allocations (History tab); figures are % of vault NAV.
Listed clips: Hyperliquid
| Time (UTC) | Instrument | Side | Size | Price | Fee | Realised close P&L |
|---|---|---|---|---|---|---|
| 2026-07-29 10:22:38 | HOOD |
Open Long | 1.1910 | 94.0470 | USDC 0.0101 | - |
| 2026-07-29 10:23:01 | GOLD |
Open Long | 0.0282 | 4034.7000 | USDC 0.1024 | - |
| 2026-07-29 10:23:38 | DRAM |
Open Long | 3.4000 | 47.8530 | USDC 0.0146 | - |
| 2026-07-29 10:24:32 | SNDK |
Open Long | 0.1430 | 1117.2000 | USDC 0.0144 | - |
| 2026-07-29 10:24:55 | Nasdaq 100 |
Open Long | 0.0041 | 27857.0000 | USDC 0.0103 | - |
| 2026-07-29 10:25:20 | NBIS |
Open Long | 0.6000 | 173.8200 | USDC 0.0094 | - |
| 2026-07-29 10:28:10 | COPPER |
Open Long | 23.7200 | 6.3231 | USDC 0.0135 | - |
| 2026-07-31 13:59:11 | SMH |
Open Long | 0.3670 | 545.5438 | USDC 0.0180 | - |
| 2026-07-31 13:59:29 | Nasdaq 100 |
Open Long | 0.0070 | 28238.0000 | USDC 0.0178 | - |
| 2026-07-31 13:59:54 | LITE |
Open Long | 0.1580 | 712.7500 | USDC 0.0101 | - |
| 2026-07-31 14:10:09 | NBIS |
Open Long | 0.6600 | 187.2600 | USDC 0.0111 | - |
| 2026-07-31 14:19:05 | SNDK |
Open Long | 0.0890 | 1232.7000 | USDC 0.0099 | - |
Realised P&L on closes. Nothing in the table above is a closing trade with booked profit or loss. Only opens, adds, or spot legs.
Appendix - sources & verification
GET https://api.volta90.trade/transactions/VLT90/epoch/16/timeline?full=true
GET https://api.volta90.trade/oracle/VLT90/epochs
GET https://api.volta90.trade/oracle/VLT90/snapshots?sort=asc&limit=1000&from=[epoch-open]&to=[epoch-close]
POST GraphQL PeriodSummary (vault week anchor; indexer endpoint in volta ops docs)
| Check | Value |
|---|---|
| Merged activity (this export) | 6999 timeline events · 167 oracle snapshots in-window |
| Boundary multisig txs (open → close) | 0xd2054d3c333fa3b0d216f0169173db17ce9d65f09aa25a81798388de9137fc24 · 0x84fca03a3e8fdc599cfab210978d257f9564dcc6decf8b431fad4f513b667121 |
| Snapshots bookends | _id 6a673a34c017ba5545586b4d → 6a705894c017ba5545587461 (167 docs) |
What this document is not: not the exchange's internal risk pack; statements follow chronological order on Volta's merged activity feed.