
Epoch card
Operator desk note
During the week of August 3 to August 9, 2026, the American markets and most risky assets experienced a rebound, marking their best performance since the end of May. The S&P 500 reached a new all-time high, while the NASDAQ approached within a few percentage points of its record high set in early June. This upward movement confirmed that the liquidation event of the Situational Awareness fund by Leopold Aschenbrenner at the end of July likely marked a market bottom, at least for the coming weeks.
Volta's strategy also observed that many so-called "risky" sectors began to show an upward trend on a daily time frame for the first time in weeks or even months. Notably, sectors like quantum, uranium, and robotics are on the rise. However, the AI memory sector struggles to convincingly rebound, mainly due to rumors of Chinese players potentially capturing market share from American and Western companies.
Precious metals such as gold and silver are also trending upwards, benefiting from recent U.S. employment figures. In contrast, Bitcoin and cryptocurrencies have remained relatively uncorrelated with other risky assets in recent months, showing minimal volatility either upwards or downwards.
In this context, Volta's strategy has reactivated purchases over the past several days, now exposing nearly 50% of its available cash to the market. A larger portion of cash will be allocated if the strategy identifies interesting intraday pullbacks to strengthen certain long positions.
Performance
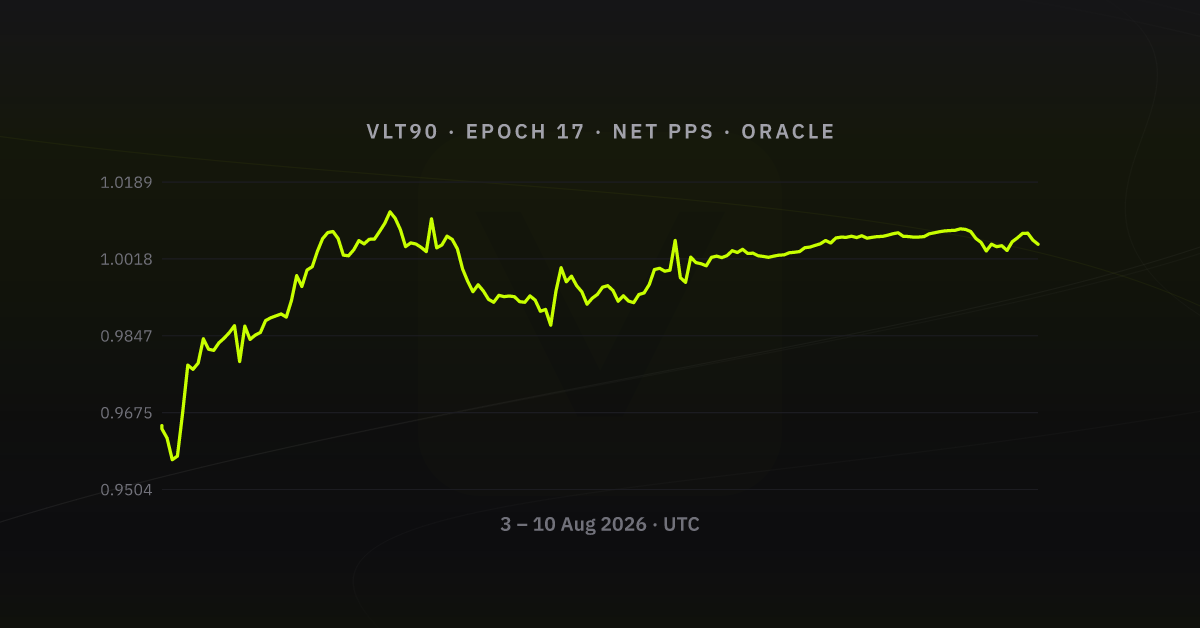
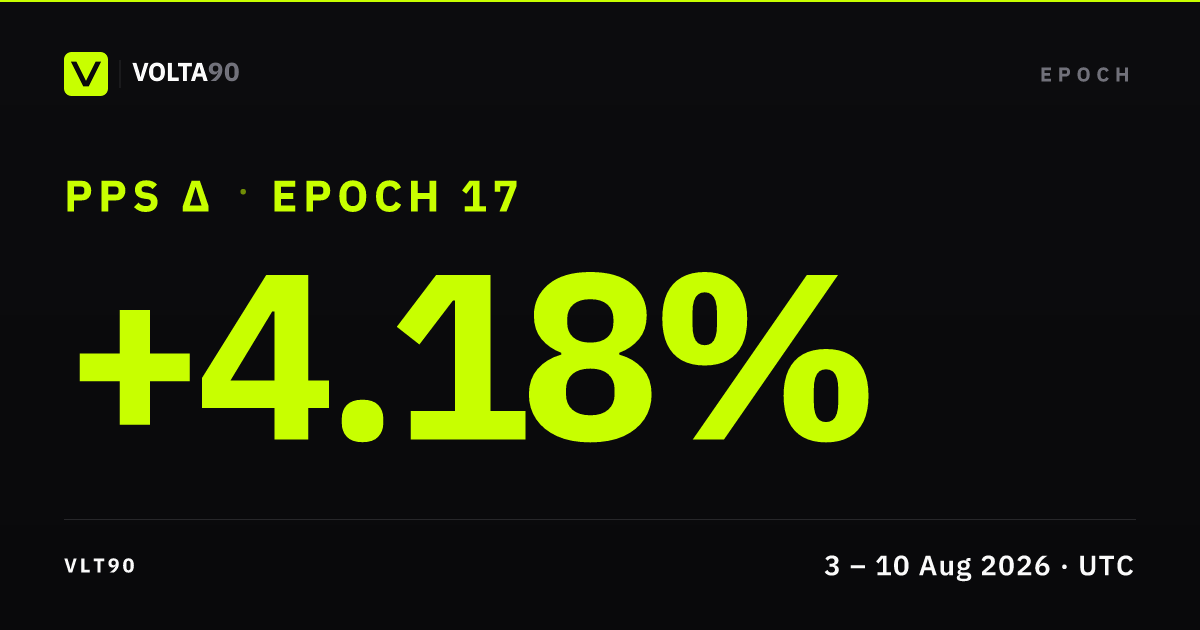
Over 2026-08-03 → 2026-08-10, net share price printed low 0.957062 and high 1.012250. The largest drawdown from a running intra-week high landed at 2.49%. That is the clearest stress point on the path. Volatility showed up in the band: low to high spanned ~5.72% versus week-open net PPS. Net PPS closed well above week open (≈ +4.18%), headline bullish drift on this measure. Open Performance in the app for the same net PPS basis with full zoom.
What drove the week
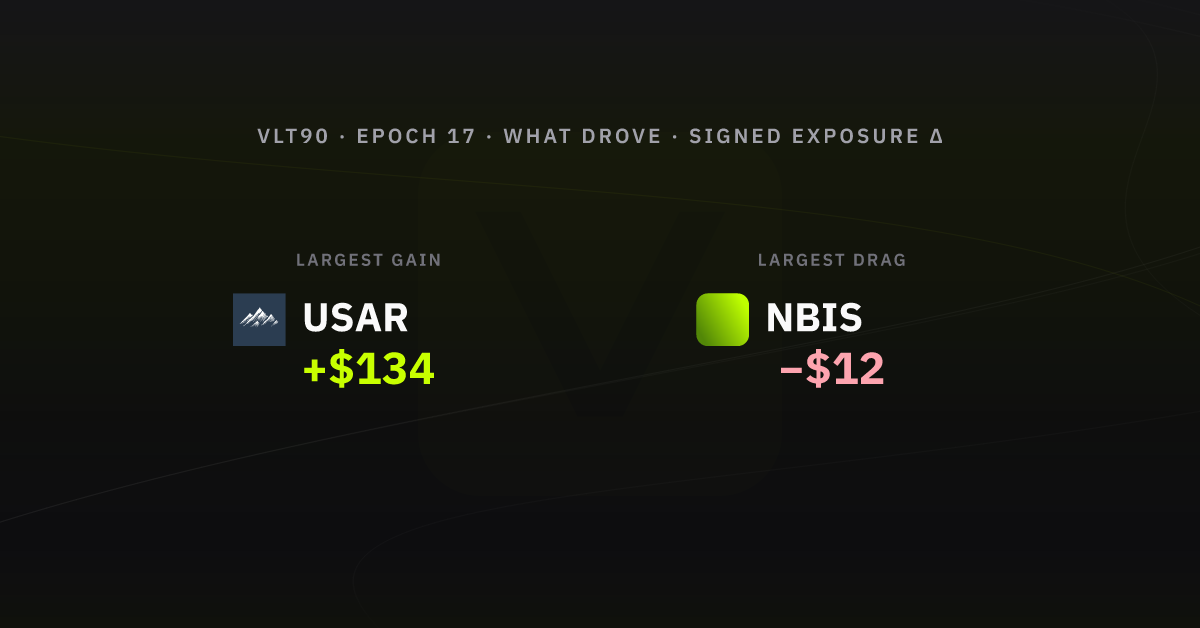
From week-open to week-end oracle snaps (cash sleeves excluded; perps: Δ unrealised P&L; spot: notional), sleeve-level marks moved most in favour of  USAR +$134 and most against
  NBIS −$12. Other listed names on the same basis moved:
  RKLB +$109,
  LITE +$98,
  SMH +$66,
  Nasdaq 100 +$43,
  HOOD +$33,
  URNM +$31,
  SNDK +$5, and
  DRAM −$2.
Allocation by asset class & gross exposure
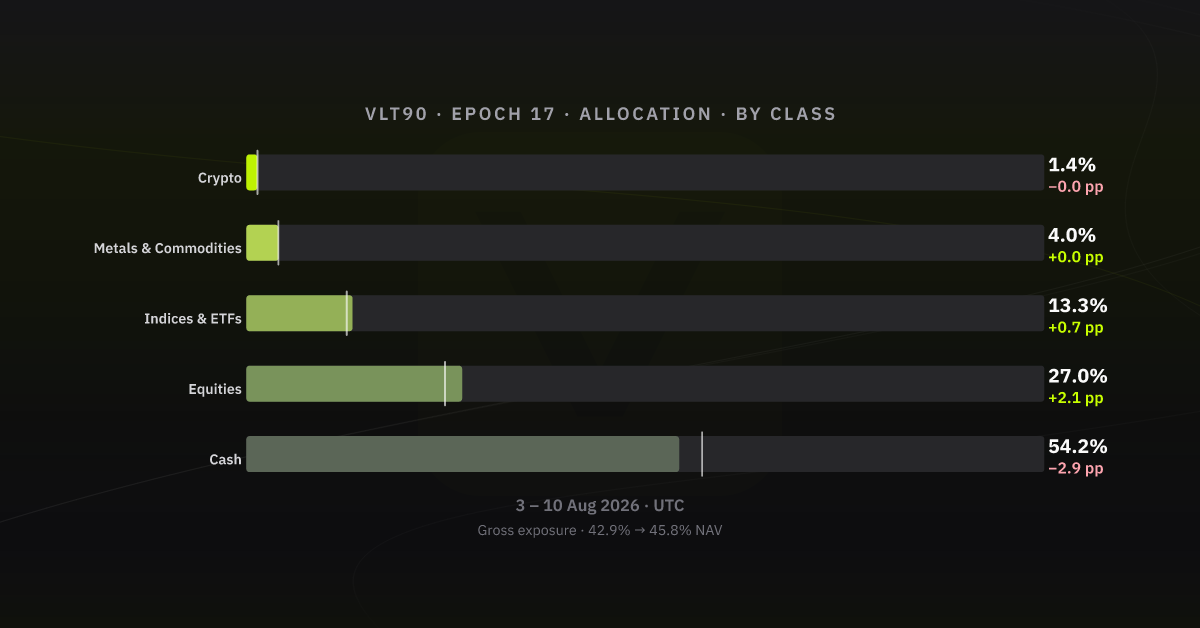
The clearest sleeve moves vs week open are Cash −2.9 pp, Equities +2.1 pp, and Indices & ETFs +0.7 pp. Gross exposure (deployed notional / NAV) moved from 42.9% to 45.8% of NAV. (+10.7 pp on gross exposure vs prior week-end). Same asset-class bands as Allocations (History tab); figures are % of vault NAV.
Listed clips: Hyperliquid
| Time (UTC) | Instrument | Side | Size | Price | Fee | Realised close P&L |
|---|---|---|---|---|---|---|
| 2026-08-04 14:22:18 | SMH |
Open Long | 0.0700 | 566.9700 | USDC 0.0036 | - |
| 2026-08-04 14:23:11 | SMH |
Close Long | 0.1620 | 566.5938 | USDC 0.0083 | 0.3073 |
| 2026-08-04 14:23:32 | Nasdaq 100 |
Close Long | 0.0025 | 29355.0000 | USDC 0.0066 | 1.9588 |
| 2026-08-04 14:23:58 | SNDK |
Close Long | 0.0470 | 1379.9000 | USDC 0.0058 | 1.0866 |
| 2026-08-04 14:24:57 | LITE |
Close Long | 0.0730 | 818.4500 | USDC 0.0054 | 5.2175 |
| 2026-08-04 14:25:53 | NBIS |
Close Long | 0.3800 | 219.7300 | USDC 0.0075 | 11.3908 |
| 2026-08-06 16:09:40 | DRAM |
Open Long | 2.1000 | 52.0401 | USDC 0.0098 | - |
| 2026-08-06 16:10:27 | URNM |
Open Long | 2.8200 | 53.1280 | USDC 0.0135 | - |
| 2026-08-06 16:10:54 | URNM |
Close Long | 2.8200 | 53.0190 | USDC 0.0135 | -0.3074 |
| 2026-08-06 16:11:09 | URNM |
Open Long | 2.8200 | 53.1238 | USDC 0.0135 | - |
| 2026-08-06 16:11:44 | HOOD |
Open Long | 1.1470 | 91.4700 | USDC 0.0094 | - |
| 2026-08-06 16:12:35 | RKLB |
Open Long | 1.1600 | 77.1400 | USDC 0.0081 | - |
Realised P&L on closes (what Hyperliquid books when a position is closed):
- NBIS +$11, about +13.64% vs the dollar size of that trade (size × price)
- LITE +$5, about +8.73% vs the dollar size of that trade (size × price)
- Nasdaq 100 +$2, about +2.67% vs the dollar size of that trade (size × price)
- SNDK +$1, about +1.68% vs the dollar size of that trade (size × price)
- URNM −$0, about -0.21% vs the dollar size of that trade (size × price)
- SMH +$0, about +0.33% vs the dollar size of that trade (size × price)
Total from these closes: about +$20, or about +0.09% of the vault’s opening NAV for the week. Trading fees on those fills are not subtracted here.
Appendix - sources & verification
GET https://api.volta90.trade/transactions/VLT90/epoch/17/timeline?full=true
GET https://api.volta90.trade/oracle/VLT90/epochs
GET https://api.volta90.trade/oracle/VLT90/snapshots?sort=asc&limit=1000&from=[epoch-open]&to=[epoch-close]
POST GraphQL PeriodSummary (vault week anchor; indexer endpoint in volta ops docs)
| Check | Value |
|---|---|
| Merged activity (this export) | 7260 timeline events · 171 oracle snapshots in-window |
| Boundary multisig txs (open → close) | 0x84fca03a3e8fdc599cfab210978d257f9564dcc6decf8b431fad4f513b667121 · 0xe729ef87f5cc24651733188a6723fce8944fa02076c9e9ecdfcac1894f18b427 |
| Snapshots bookends | _id 6a7066a6c017ba554558746f → 6a79af34c017ba5545587dad (171 docs) |
What this document is not: not the exchange's internal risk pack; statements follow chronological order on Volta's merged activity feed.