
Epoch card
Operator desk note
The week of September 21 to 27 saw increasing divergences among different asset classes. Bond markets continued to experience tension, with a significant drop in bond prices corresponding to a sharp rise in interest rates. Benchmark bond yields, such as the 10-year and 30-year U.S. Treasuries, reached levels not seen in two decades. Despite high-profile meetings at the UN and discussions between Donald Trump and Xi Jinping, there was little change in the global geopolitical situation over the week.
This environment has fostered a risk-off sentiment, particularly affecting assets sensitive to high interest rates and geopolitical uncertainty, such as small caps and precious metals. Strategically, it may be prudent to reduce exposure to these assets and focus on larger companies or index ETFs like the NASDAQ, which are less likely to be stressed by high rates. Surprisingly, cryptocurrencies, especially altcoins, have performed well despite the challenging environment. However, as we approach the last quarter of 2026, caution is advised to anticipate any potential intermediate corrections in this market.
In response to these conditions, Volta's portfolio allocation remains balanced, allowing flexibility to act based on evolving scenarios. We have begun to increase our exposure to the cryptocurrency market, maintaining room to buy more if a correction occurs. Our exposure to precious metals is currently light, with plans to strengthen it when gold and silver prices return to their 2026 lows.
Our equity exposure is primarily concentrated on the NASDAQ and semiconductor sectors, which are currently benefiting from profits related to artificial intelligence. These sectors are well-positioned to withstand further macroeconomic and interest rate challenges in the coming weeks. We are also closely monitoring the biotech sector to potentially reduce our exposure if it becomes more sensitive to rising interest rates.
Performance
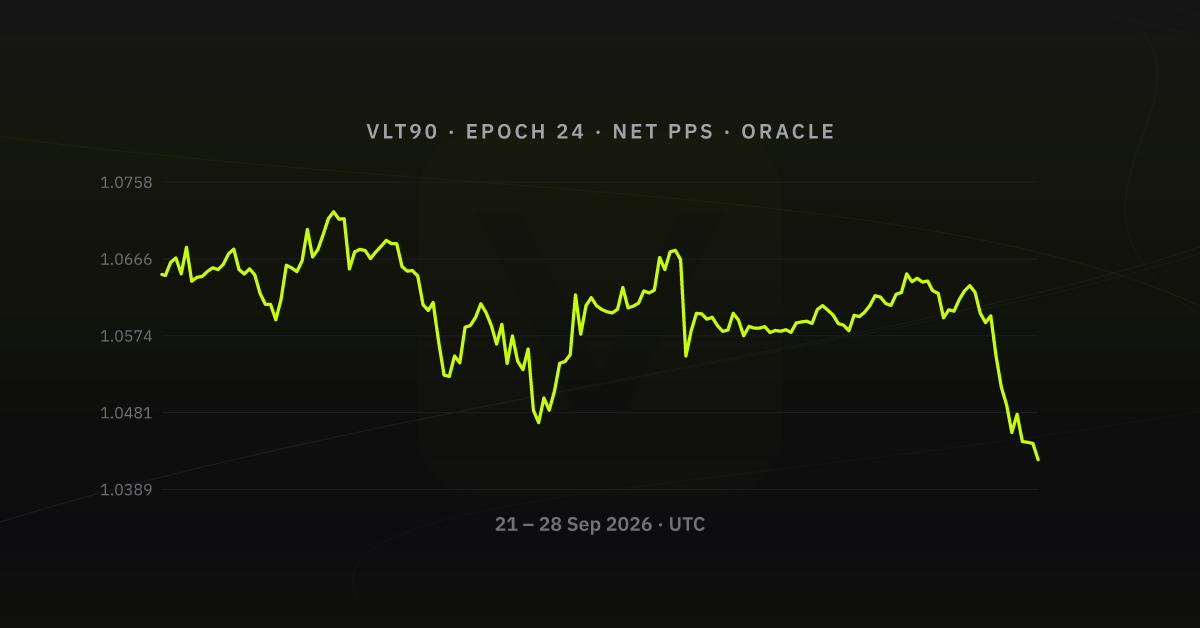
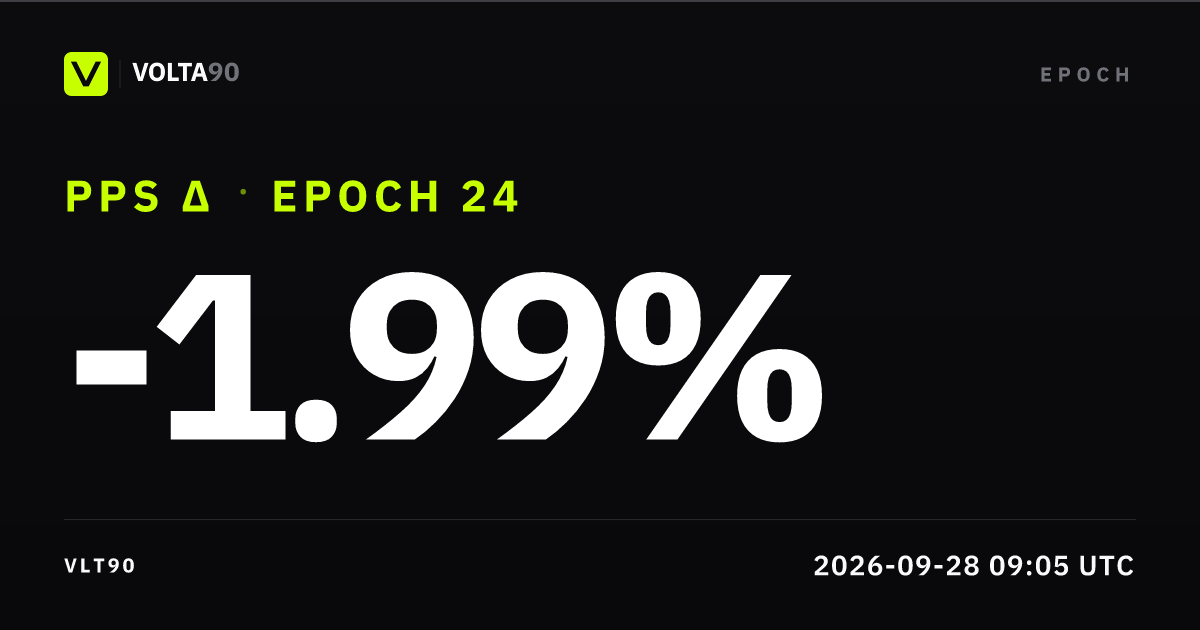
Over 2026-09-21 → 2026-09-28, net share price printed low 1.042491 and high 1.072259. The largest drawdown from a running intra-week high landed at 2.78%. That is the clearest stress point on the path. Volatility showed up in the band: low to high spanned ~2.80% versus week-open net PPS. Into the last tick, PPS sat meaningfully below week open (≈ -2.09%), a soft weekly finish. Open Performance in the app for the same net PPS basis with full zoom.
What drove the week
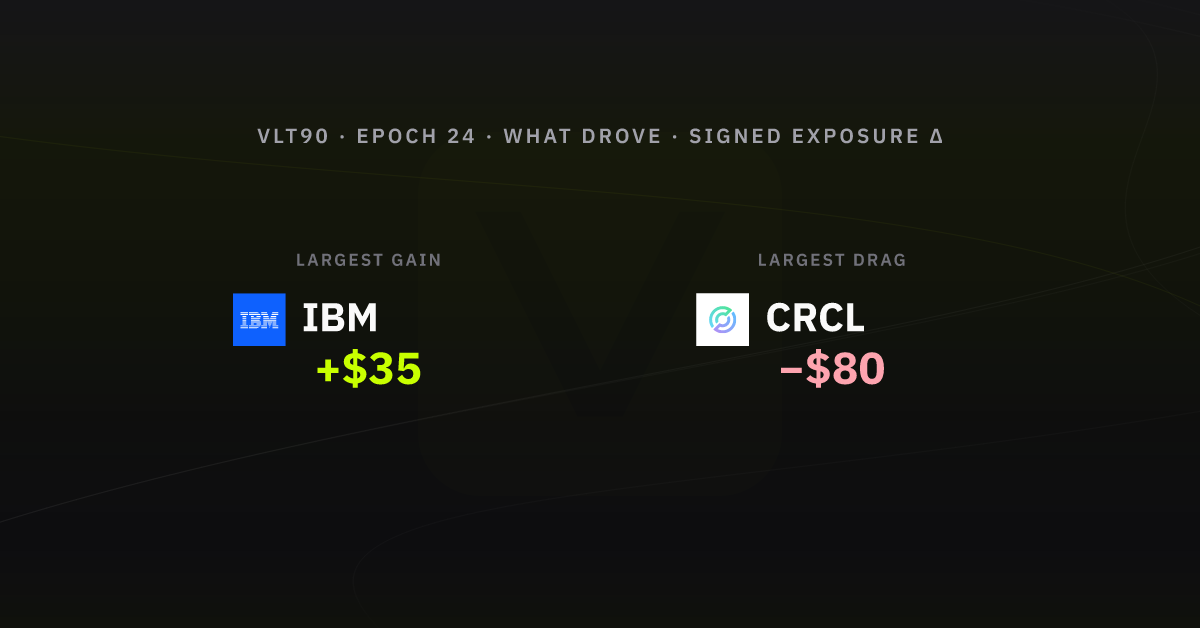
From week-open to week-end oracle snaps (cash sleeves excluded; perps: Δ unrealised P&L; spot: notional), sleeve-level marks moved most in favour of  IBM +$35 and most against
  CRCL −$80. Other listed names on the same basis moved:
  USAR −$37,
  ETH −$18,
  COPPER −$17,
  LITE −$14,
  XBI −$8,
  XYZ100 +$6,
  NBIS −$5,
  IONQ −$4, and
  ARM +$4.
Allocation by asset class & gross exposure
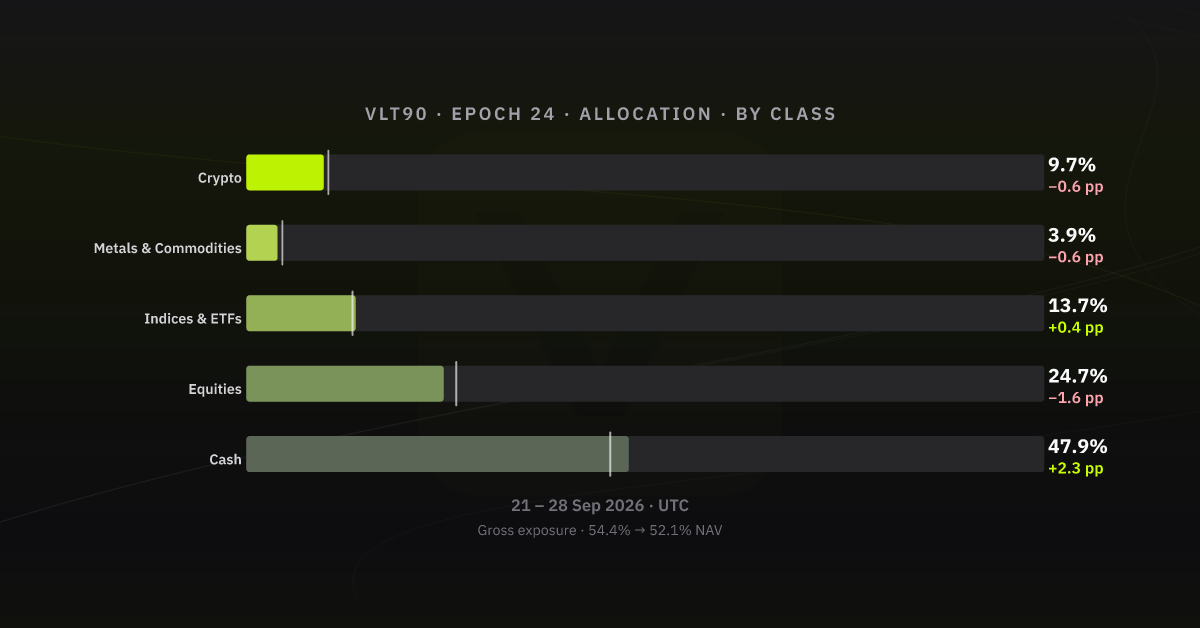
The clearest sleeve moves vs week open are Cash +2.3 pp, Equities −1.6 pp, and Metals & Commodities −0.6 pp. Gross exposure (deployed notional / NAV) moved from 54.4% to 52.1% of NAV. (-2.3 pp on gross exposure vs prior week-end). Same asset-class bands as Allocations (History tab); figures are % of vault NAV.
Listed clips: Hyperliquid
| Time (UTC) | Instrument | Side | Size | Price | Fee | Realised close P&L |
|---|---|---|---|---|---|---|
| 2026-09-21 15:06:31 | LITE |
Close Long | 0.0510 | 972.5100 | USDC 0.0045 | 11.5021 |
| 2026-09-21 15:06:49 | XYZ100 |
Close Long | 0.0024 | 30269.0000 | USDC 0.0065 | 3.3903 |
| 2026-09-21 15:07:51 | NBIS |
Close Long | 0.3300 | 231.2500 | USDC 0.0069 | 9.1157 |
| 2026-09-21 15:08:28 | ETH |
Close Long | 0.0236 | 2749.9000 | USDC 0.0292 | 4.8923 |
| 2026-09-21 15:09:14 | IBM |
Close Long | 0.5000 | 229.5000 | USDC 0.0099 | -35.6900 |
| 2026-09-21 15:09:28 | COPPER |
Close Long | 14.7400 | 6.7811 | USDC 0.0086 | 10.3033 |
| 2026-09-22 14:23:26 |  Arbitrum Arbitrum |
Open Long | 1865.4000 | 0.2145 | USDC 0.1801 | - |
| 2026-09-22 14:24:18 | Arbitrum |
Close Long | 1865.4000 | 0.2148 | USDC 0.1803 | 0.4498 |
| 2026-09-22 14:24:54 | Arbitrum |
Open Long | 1861.9000 | 0.2147 | USDC 0.1799 | - |
| 2026-09-22 21:10:25 | IONQ |
Open Long | 5.6300 | 44.7141 | USDC 0.0227 | - |
| 2026-09-22 21:13:00 | ARM |
Close Long | 0.8700 | 331.3300 | USDC 0.0259 | 33.5590 |
| 2026-09-22 23:45:45 | Arbitrum |
Close Long | 63.9000 | 0.2349 | USDC 0.0023 | 1.2876 |
| 2026-09-22 23:45:47 | Arbitrum |
Close Long | 802.6000 | 0.2349 | USDC 0.0283 | 16.1724 |
| 2026-09-23 16:46:27 | XBI |
Open Long | 0.7600 | 155.5030 | USDC 0.0106 | - |
| 2026-09-23 16:47:41 | USAR |
Open Long | 6.2200 | 16.0729 | USDC 0.0090 | - |
| 2026-09-24 14:46:37 | NBIS |
Close Long | 0.3200 | 243.7500 | USDC 0.0070 | 12.8395 |
| 2026-09-24 14:48:14 | Arbitrum |
Open Long | 848.1000 | 0.2167 | USDC 0.0827 | - |
Realised P&L on closes (what Hyperliquid books when a position is closed):
- IBM −$36, about -31.10% vs the dollar size of that trade (size × price)
- ARM +$34, about +11.64% vs the dollar size of that trade (size × price)
- NBIS +$22, about +14.23% vs the dollar size of that trade (size × price) (2 closes)
- Arbitrum +$18, about +2.96% vs the dollar size of that trade (size × price) (3 closes)
- LITE +$12, about +23.19% vs the dollar size of that trade (size × price)
- COPPER +$10, about +10.31% vs the dollar size of that trade (size × price)
- ETH +$5, about +7.54% vs the dollar size of that trade (size × price)
- XYZ100 +$3, about +4.67% vs the dollar size of that trade (size × price)
Total from these closes: about +$68, or about +0.36% of the vault’s opening NAV for the week. Trading fees on those fills are not subtracted here.
Appendix - sources & verification
GET http://127.0.0.1:3000/oracle/VLT90/epochs
GET http://127.0.0.1:3000/oracle/VLT90/snapshots?sort=asc&limit=1000&from=[epoch-open]&to=[epoch-close]
POST GraphQL PeriodSummary (vault week anchor; indexer endpoint in volta ops docs)
| Check | Value |
|---|---|
| Merged activity (this export) | 6242 timeline events · 168 oracle snapshots in-window |
| Boundary multisig txs (open → close) | 0xe66596bf0fff661e0baa2fe3c402f9b80f10e8cd751a5166ae1facc1ccad8d2e · 0xa9656d8dfbce289741f38ca66a09d48649d46518957e0db33aad27c2716ac9dc |
| Snapshots bookends | _id 11881 → 12216 (168 epoch-window docs; performance chart 168 ticks from 2026-09-21) |
What this document is not: not the exchange's internal risk pack; statements follow chronological order on Volta's merged activity feed.