
Epoch card
Operator desk note
During the week of October 19 to 25, there was a continued downward trend in high beta and momentum stocks. Notably, shares in the artificial intelligence sector, particularly within semiconductors and NeoCloud, were heavily sold off. This sell-off contributed to a decline in the NASDAQ, which is now down more than 8% from its early October peak. The broader market environment, influenced by unresolved geopolitical tensions in Iran, the upcoming U.S. Federal Reserve meeting on October 28, and the midterm elections on November 3, has led to increased caution among market participants.
Amidst this risk-off sentiment, the third-quarter earnings season is underway, with a focus on whether the tech and cloud giants' results justify the substantial investments being funneled into artificial intelligence, especially through data centers. While Bitcoin and cryptocurrencies are also feeling the pressure, they have shown more resilience compared to U.S. tech stocks. Bitcoin is currently testing its support level at $80,000, and further downward pressure could challenge the overall bullish trend that has been in place since late August.
In contrast, sectors such as healthcare, financials, and consumer staples have shown upward trends over the week, as has the equal-weighted S&P 500. The Volta portfolio strategy is therefore contingent on the following scenarios: If a sector rotation continues with a rebound in semiconductor stocks while defensive sectors and the equal-weighted S&P 500 correct, it would indicate a continuation of this year's sharp sector rotation, prompting a more bullish stance. Conversely, if defensive stocks and the equal-weighted S&P 500 decline alongside tech and semiconductor stocks, it could signal the onset of a more pronounced correction, warranting a continued defensive strategy with no additional purchases for now.
The upcoming week, with the Federal Reserve meeting and earnings from the "Magnificent 7" tech companies, is expected to bring higher-than-average volatility.
Performance
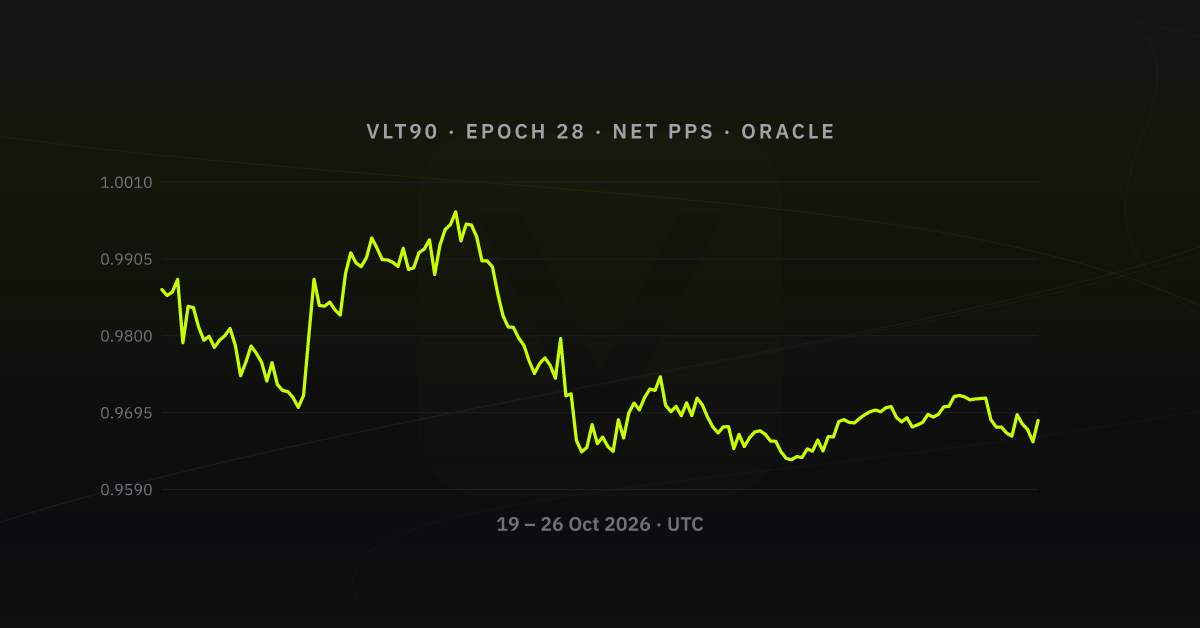
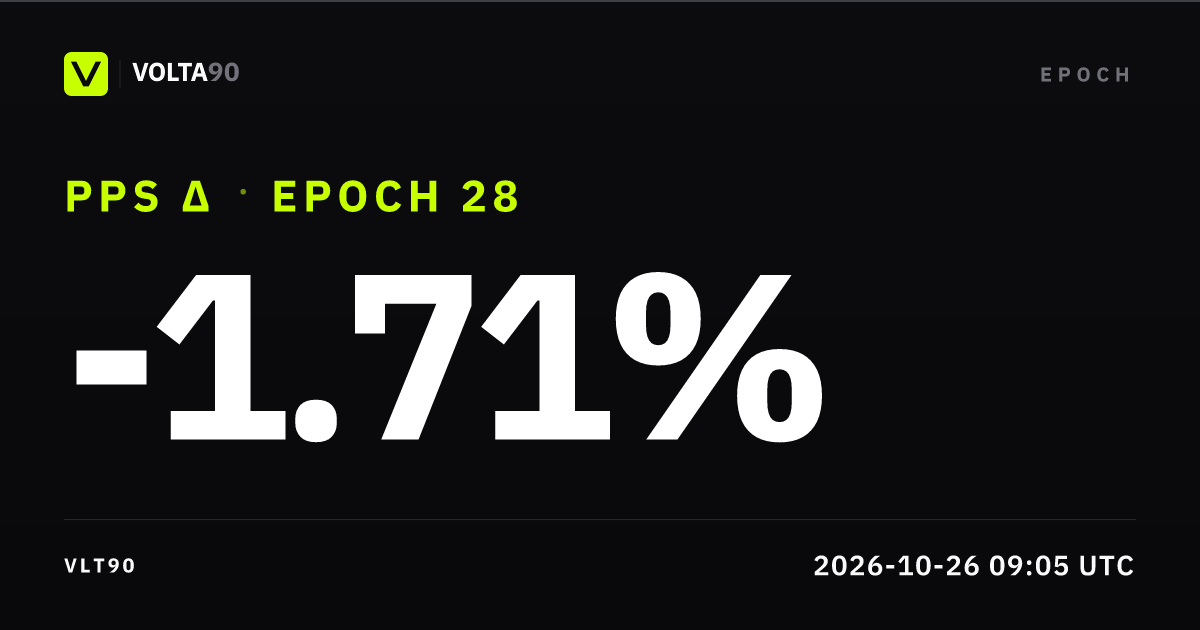
Over 2026-10-19 → 2026-10-26, net share price printed low 0.963105 and high 0.996976. The largest drawdown from a running intra-week high landed at 3.40%. That is the clearest stress point on the path. Volatility showed up in the band: low to high spanned ~3.43% versus week-open net PPS. Into the last tick, PPS sat meaningfully below week open (≈ -1.81%), a soft weekly finish. Open Performance in the app for the same net PPS basis with full zoom.
What drove the week
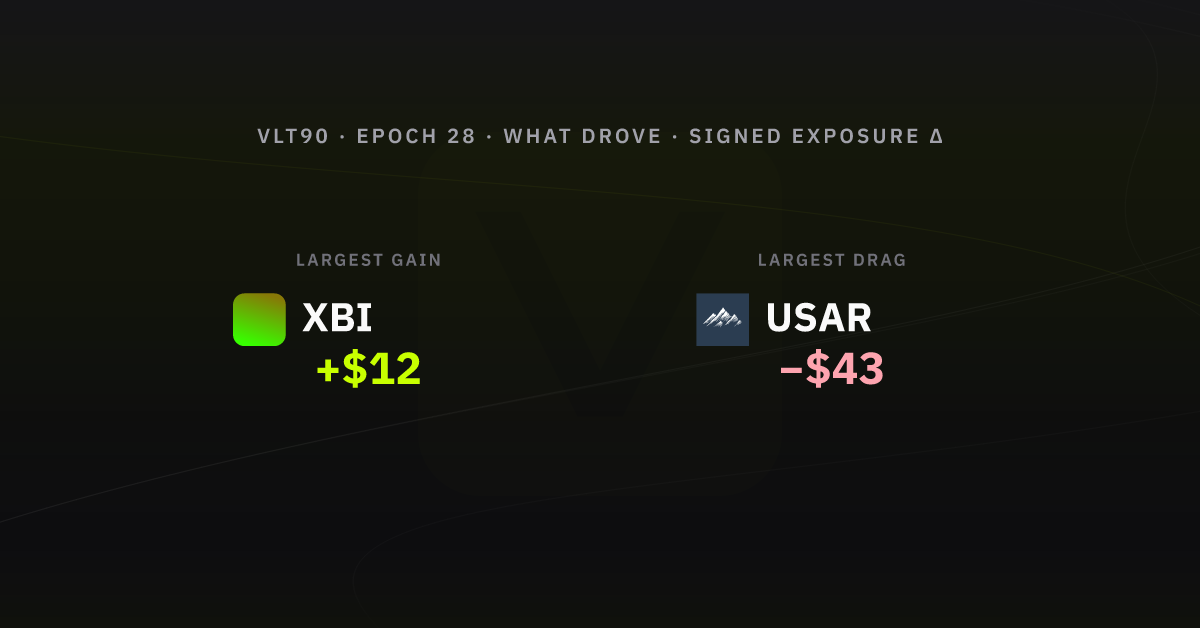
From week-open to week-end oracle snaps (cash sleeves excluded; perps: Δ unrealised P&L; spot: notional), sleeve-level marks moved most in favour of  XBI +$12 and most against
 USAR −$43. Other listed names on the same basis moved:
 HYPE −$17.
Allocation by asset class & gross exposure
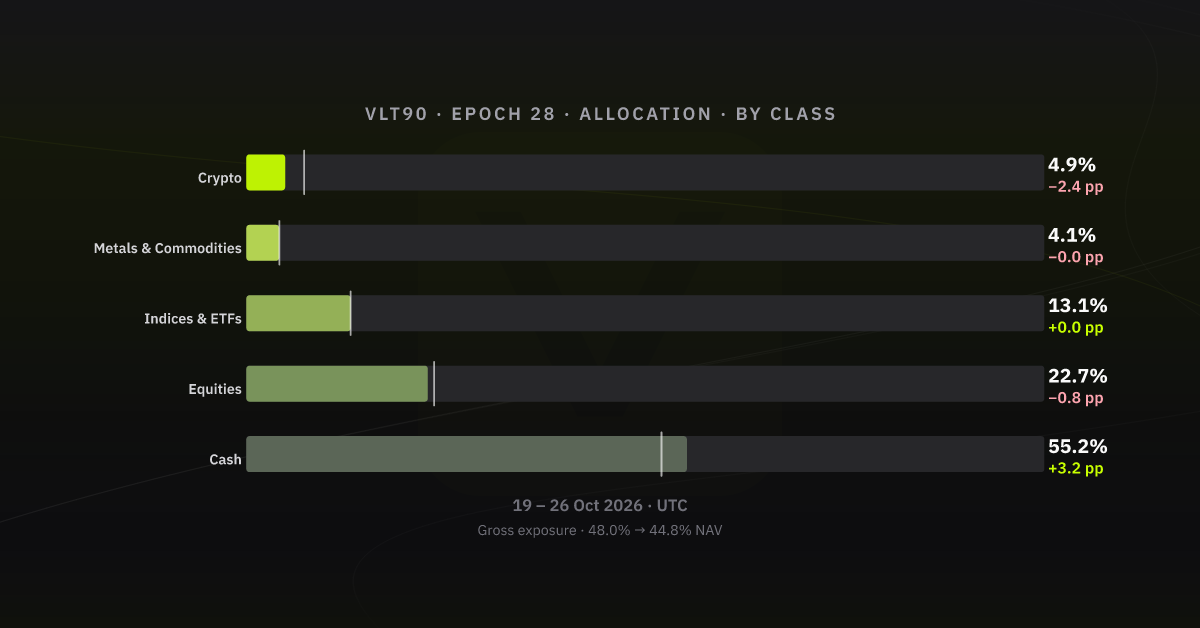
The clearest sleeve moves vs week open are Cash +3.2 pp, Crypto −2.4 pp, and Equities −0.8 pp. Gross exposure (deployed notional / NAV) moved from 48.0% to 44.8% of NAV. (-3.2 pp on gross exposure vs prior week-end). Same asset-class bands as Allocations (History tab); figures are % of vault NAV.
Listed clips: Hyperliquid
| Time (UTC) | Instrument | Side | Size | Price | Fee | Realised close P&L |
|---|---|---|---|---|---|---|
| 2026-10-20 10:22:54 | HL spot / stable basket | Buy | 0.0001 | 81501.0000 | UBTC 0.0000 | - |
| 2026-10-20 10:23:07 | HL spot / stable basket | Sell | 0.0001 | 81503.0000 | USDC 0.0074 | -0.0072 |
| 2026-10-21 00:00:00 | HL spot / stable basket | Spot Dust Conversion | 0.0000 | 82947.0000 | USDC 0.0000 | - |
| 2026-10-24 14:17:09 | HYPE |
Close Long | 5.1000 | 74.9740 | USDC 0.1721 | -17.1717 |
Realised P&L on closes (what Hyperliquid books when a position is closed):
- HYPE −$17, about -4.49% vs the dollar size of that trade (size × price)
- HL spot / stable basket −$0, about -0.07% vs the dollar size of that trade (size × price)
Total from these closes: about −$17, or about -0.10% of the vault’s opening NAV for the week. Trading fees on those fills are not subtracted here.
Appendix - sources & verification
GET http://127.0.0.1:3000/oracle/VLT90/epochs
GET http://127.0.0.1:3000/oracle/VLT90/snapshots?sort=asc&limit=1000&from=[epoch-open]&to=[epoch-close]
POST GraphQL PeriodSummary (vault week anchor; indexer endpoint in volta ops docs)
| Check | Value |
|---|---|
| Merged activity (this export) | 5847 timeline events · 168 oracle snapshots in-window |
| Boundary multisig txs (open → close) | 0xe98efb6b0a5f0004668415e11e9dfbddf9ac5a55a60d85ff5ebe950eb2b3f601 · 0x6838f0119933b5942c6d19fa7505d7a2fbbb3a53987a879e96e906621ac023af |
| Snapshots bookends | _id 13178 → 13512 (168 epoch-window docs; performance chart 168 ticks from 2026-10-19) |
What this document is not: not the exchange's internal risk pack; statements follow chronological order on Volta's merged activity feed.